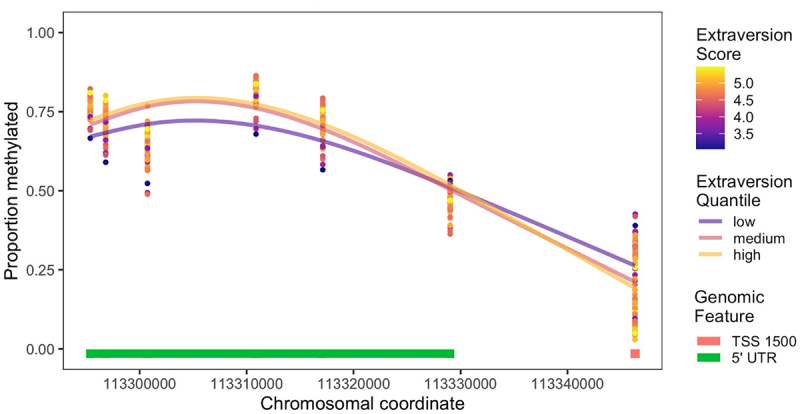
Figure 3.

Methylation levels for individual DRD2 CpG sites loading onto composite measures PC1 and PC4. Each point represents methylation values for each individual at each CpG site and is coloured by that individual’s Extraversion score. Lines are loess smoothed methylation values for each quartile for Extraversion score. TSS 1500 = within 1500 bp of a transcription start site and 5’ UTR = within the 5’ untranslated region of DRD2. Chromosomal coordinates are in base pairs and refer to human genome build hg19.
