Figure 1.
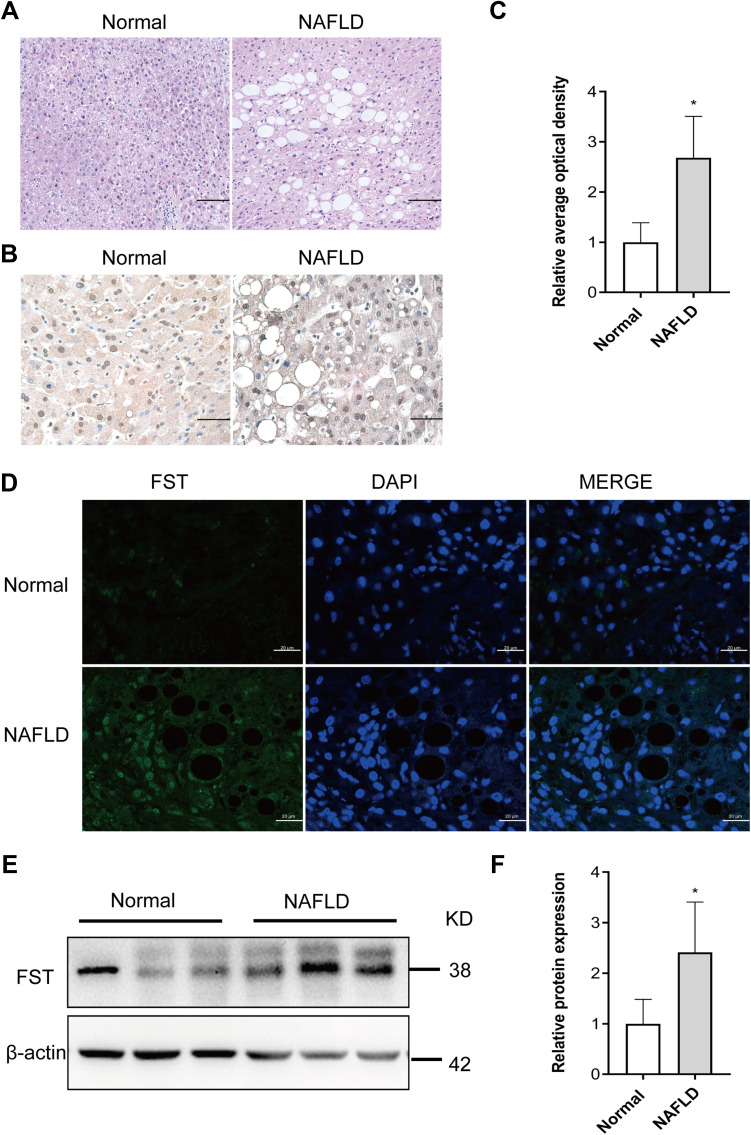
Hepatic FST level was elevated in NAFLD liver samples compared to normal liver samples. (A) H&E staining of liver sections in NAFLD and normal liver samples (200×, scale bar: 100 µm). (B and C) Immunohistochemical staining and analysis result of hepatic FST in NAFLD and normal liver samples (400×, scale bar: 50 µm). (D) Immunofluorescence staining of hepatic FST in NAFLD and normal liver samples. (630×, scale bar: 20 µm). (E and F) The protein level and analysis result of hepatic FST in NAFLD and normal liver samples. β-actin was used as a loading control.
Note: n= 6. *P< 0.05 vs normal group.
Abbreviations: FST, follistatin; NAFLD, non-alcoholic fatty liver disease; H&E, hematoxylin and eosin.

