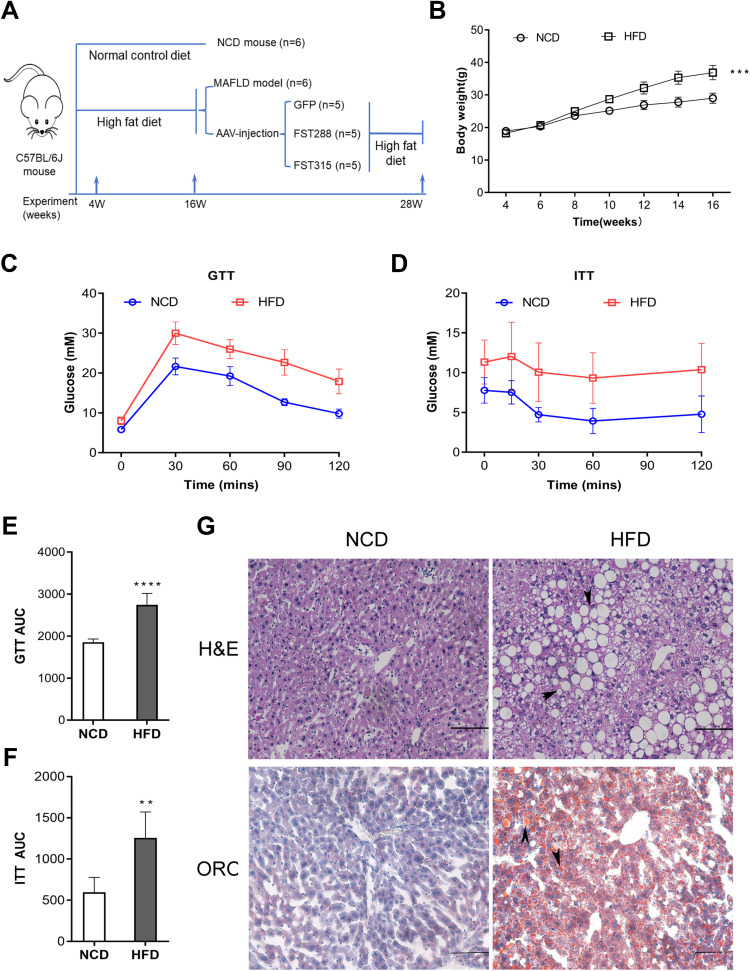
Figure 5.
Establishment and characterization of NAFLD mice model fed with HFD. (A) The schematic diagram of mice experiments. (B) Body weight of NCD and HFD mice. (C and D) GTT and ITT results in NCD and HFD mice. (E and F) AUC for GTT and ITT. (G) H&E and Oil Red O staining in NCD and HFD mice (200×, scale bar: 100 µm). The marks represented the main pathohistological findings.
Notes: n= 6. **P< 0.01, ***P< 0.001, ****P< 0.0001 vs NCD group.
Abbreviations: NAFLD, non-alcoholic fatty liver disease; HFD, high-fat diet; NCD, normal control diet; GTT, glucose tolerance test; ITT, insulin tolerance test; AUC, area under the curve; H&E, hematoxylin and eosin; ORO, oil red O.

