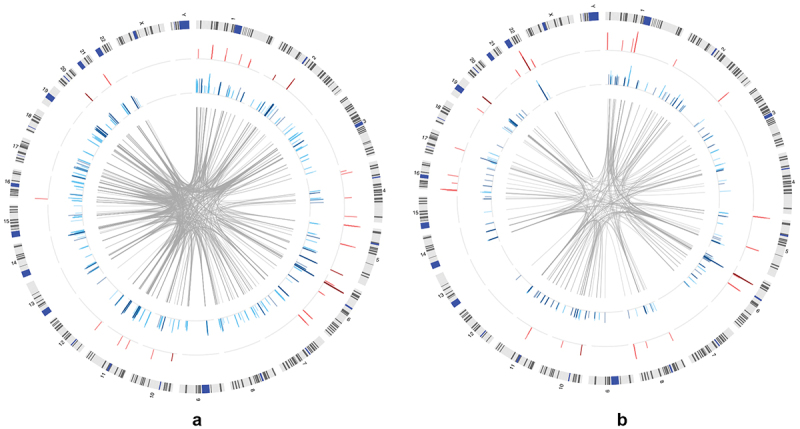
Figure 2.

Distribution of significant connections between DNA methylation and transcript expression across the genome in the AYATS (2a) and PREG (2b) cohorts. The location of significant cis (red track) and trans relationships (blue track) across the genome (ideogram of human chromosomes, outer track) is shown. Bar graphs show the direction of the relationship (positive relationships are shown in the darker color) and the relative magnitude of the effect (height of bars; defined by adjusted R-squared values). Trans CpG-GE relationships often spanned chromosomes (location of associated CpG-GE pairs shown by center grey links).
