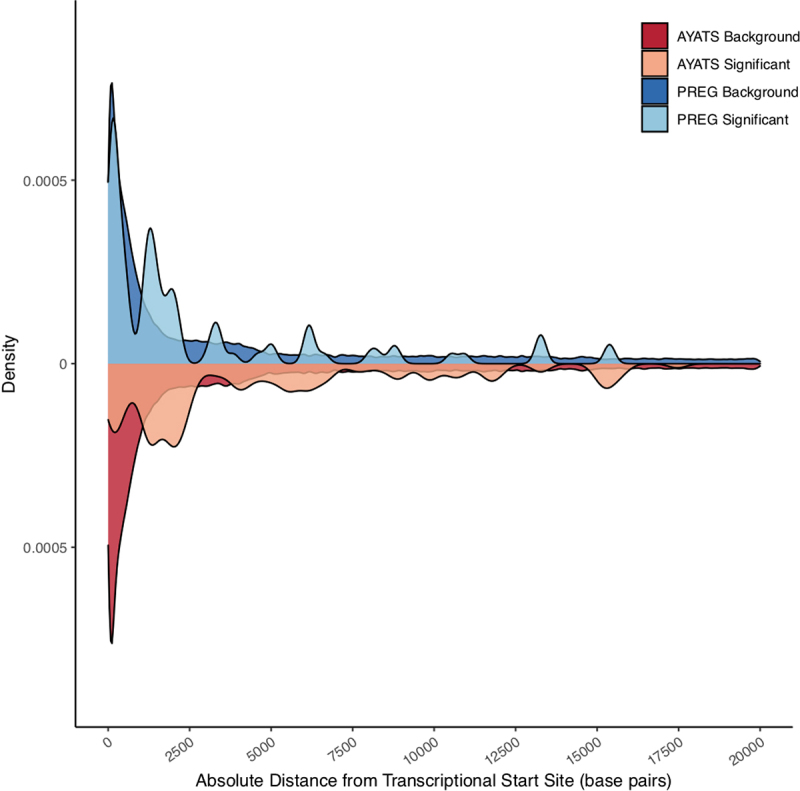
Figure 3.

Absolute distance between CpG probes and transcriptional start sites (TSS) of proximal genes. A density plot depicting the absolute distance of DNA methylation microarray probes (darker colour) relative to the GE-associated CpG sites (lighter colour) from the transcriptional start sites of cis genes. Both the AYATS (red) and PREG (blue) cohorts showed enrichment in areas flanking active transcription. The proportion of GE-associated CpGs compared to the CpGs represented on the microarray was highest in areas directly downstream of the TSS.
