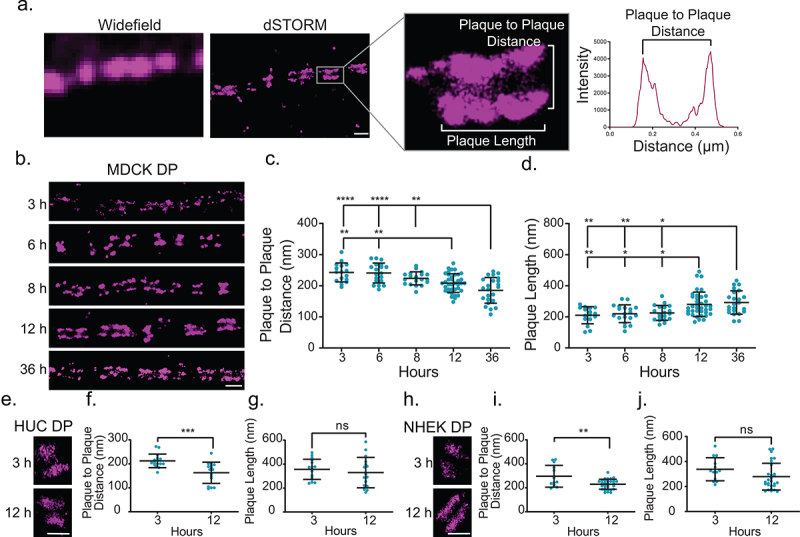
Figure 1.

Desmoplakin architecture changes as desmosome mature. (a) Images of desmosomes (MDCK cells labeled for desmoplakin rod/C-terminal domain) illustrating the improved resolution of direct stochastic optical reconstruction microscopy (dSTORM) compared to widefield microscopy. The region of interest shows a single desmosome and illustrates the measurements obtained from dSTORM images. The plaque-to-plaque distance is quantified as illustrated in the plot of fluorescence intensity as a function of distance for a line scan through the desmosome. Scale bar = 0.5 μm. (b-d) MDCK cells were stained for the desmoplakin rod/C-term junction following Ca2+ switch for 3, 6, 8, 12, and 36 h as indicated. (b) Representative dSTORM images of cell-cell borders at each timepoint. (c) Plaque-to-plaque distance and (d) plaque length at each timepoint (mean ± SD; datapoints are individual desmosomes). (e) HUC dSTORM images at 3 and 12 h, (f) plaque-to-plaque distance, and (g) plaque length at each timepoint (mean ± SD). (e) NHEK dSTORM images at 3 and 12 h, (f) plaque-to-plaque distance, and (g) plaque length at each timepoint (mean ± SD). (b, e and h) Scale bars = 1 μm. (ns, not significant, * P ≤ .05, ** P ≤ .01, *** P ≤ .001, and **** P ≤ .0001 by (c, d) ANOVA with post hoc Tukey’s test or f, g, i and j) Student’s t-test. (c and d) (MDCK 3 h n = 16, 6 h n = 19, 8 h n = 19, 12 h n = 37, and 36 h n = 23) and (f and g) (HUC 3 h n = 16 and 12 h n = 16); and (i and j) (NHEK 3 h n = 13 and 6 h n = 31). Experiments were performed in triplicate.
