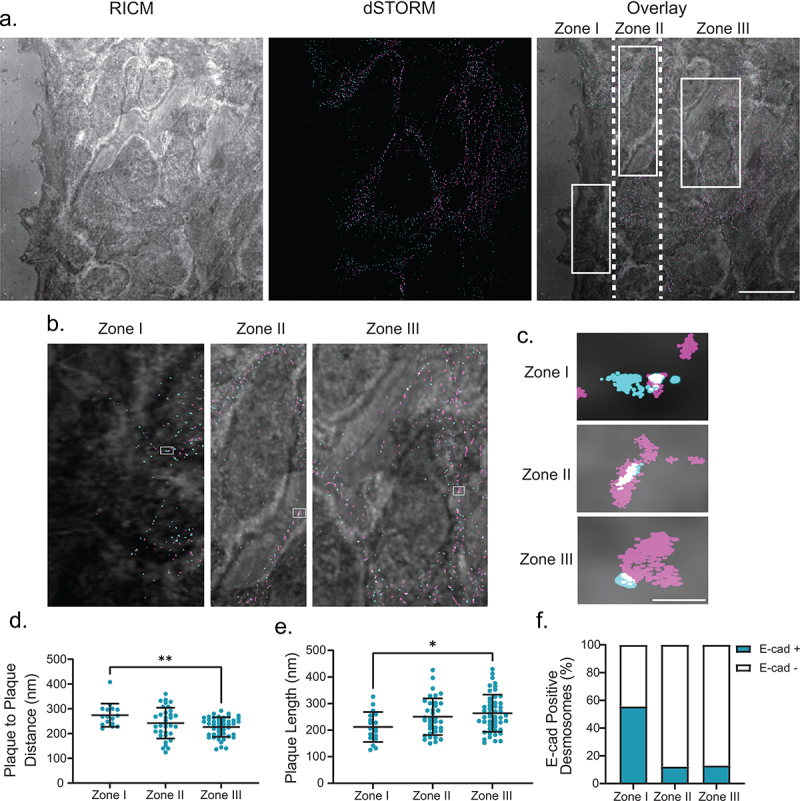
Figure 5.

Changing architecture is consistent in migrating cells. (a) The left panel shows a representative RICM image of the scratch, the middle panel shows a two-color dSTORM image of desmosomes at the scratch (magenta: desmoplakin, cyan: E-cadherin), and the right panel shows the overlay of the RICM and dSTORM images. Desmosomes at the first half of the cells at the leading edge of the scratch are defined as Zone 1, the back half of the same cells are defined as Zone 2, and cells behind the leading edge are defined as Zone 3. (b) depicts a representative zoomed in the area of each Zone. (c) depicts a representative single desmosome from each corresponding zone. Quantification of plaque-to-plaque distance (d), plaque length (e), and percent E-cad-positive desmosomes (f) for each zone. (Zone I n = 16, Zone II n = 34, and Zone III n = 47). Scale bar = 5 μm (A) 0.25 μm (b,c). * P ≤ .05, ** P ≤ .01 by ANOVA with post hoc Tukey’s test.
