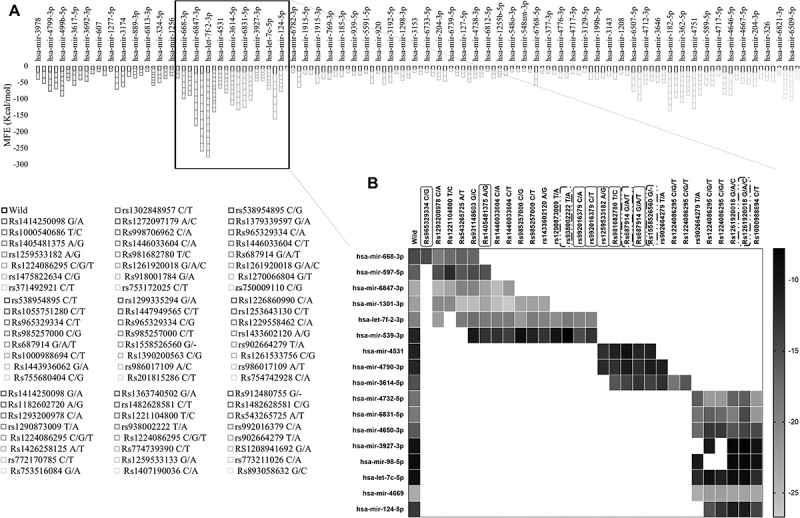
Figure 7.

PRKCE gene interaction with miRNAs modulated by its 5'UTR variations. (A) Minimum free energies (MFE) for each PRKCE variation and miRNA interaction were plotted at the y-axis. Around 30 variants were identified that were clustered in miRNA binding sites and greatly affected the miRNA-mRNA interaction. Black outlined boxes indicate wildtype PRKCE-miRNA MFE, whereas different shades of grey represent variant PRKCE. (B) Heatmap for the sorted PRKCE variants vs miRNAs. Darker or near black colour depict less binding affinity while lighter or near white colour boxes represent high binding affinity. Variants that decreased the PRKCE and miRNA interaction are highlighted with grey box, whereas variants that enhanced their interaction are depicted within grey dotted box.
