
FIGURE 3.
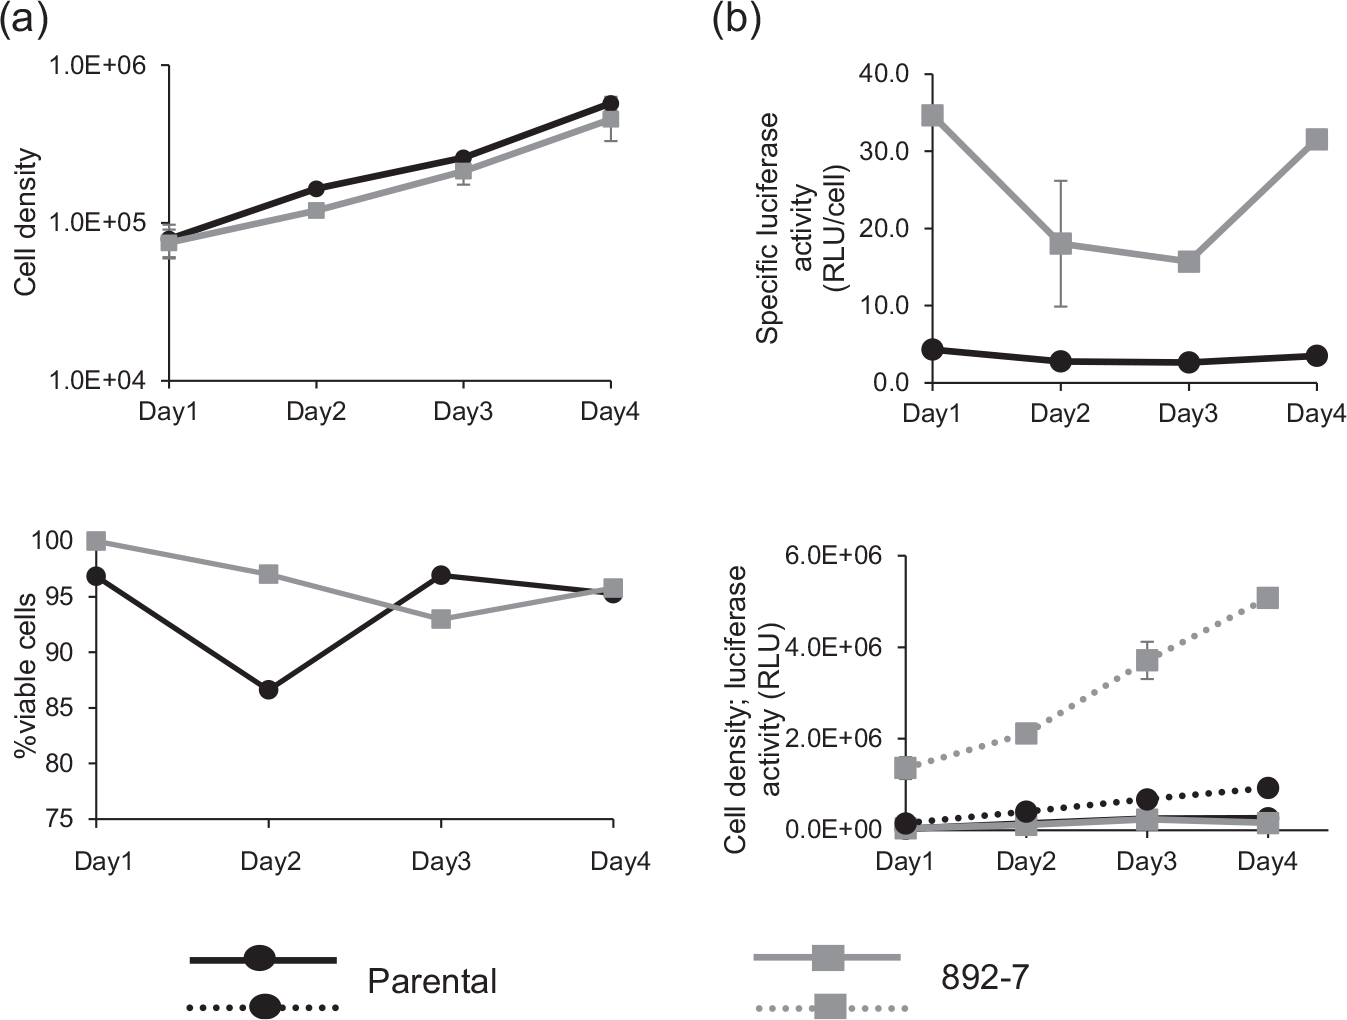
Growth and luciferase production in the 892–7 clone and parental cell line for 4 days growth period. (a) Cell density and viability. (b) Specific and total luciferase production. Graphs are representative of three separate growth and production experiments, and error bars represent the standard deviation