FIGURE 5.

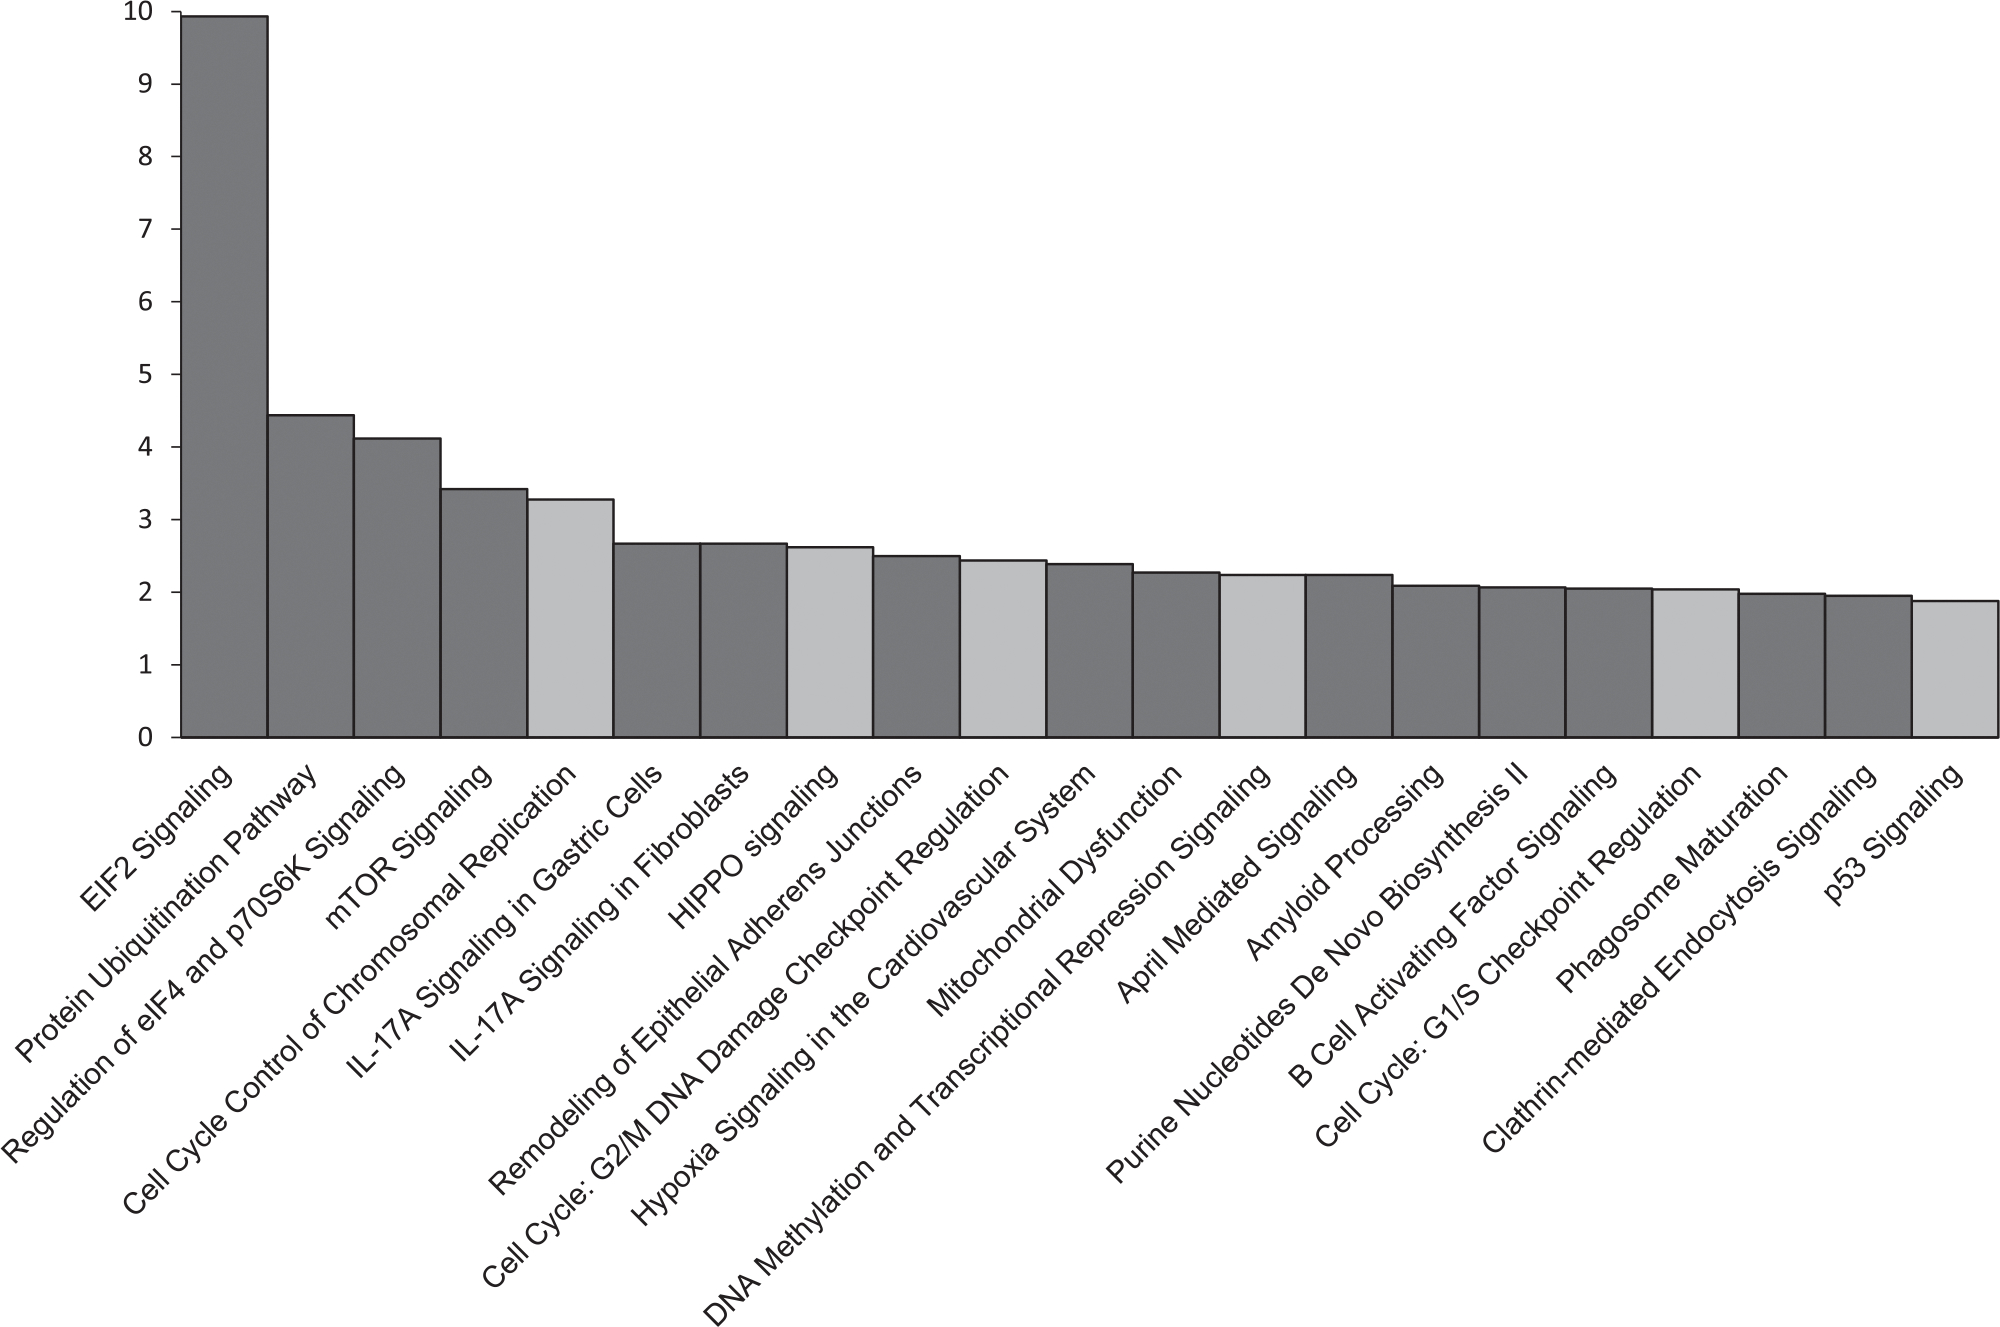
Pathway ranking based on Z-score following enrichment analysis of the differentially expressed genes between the CASP8AP2 knockout and the parental cell lines. Gray bars represent pathways involved in the cell cycle

Pathway ranking based on Z-score following enrichment analysis of the differentially expressed genes between the CASP8AP2 knockout and the parental cell lines. Gray bars represent pathways involved in the cell cycle