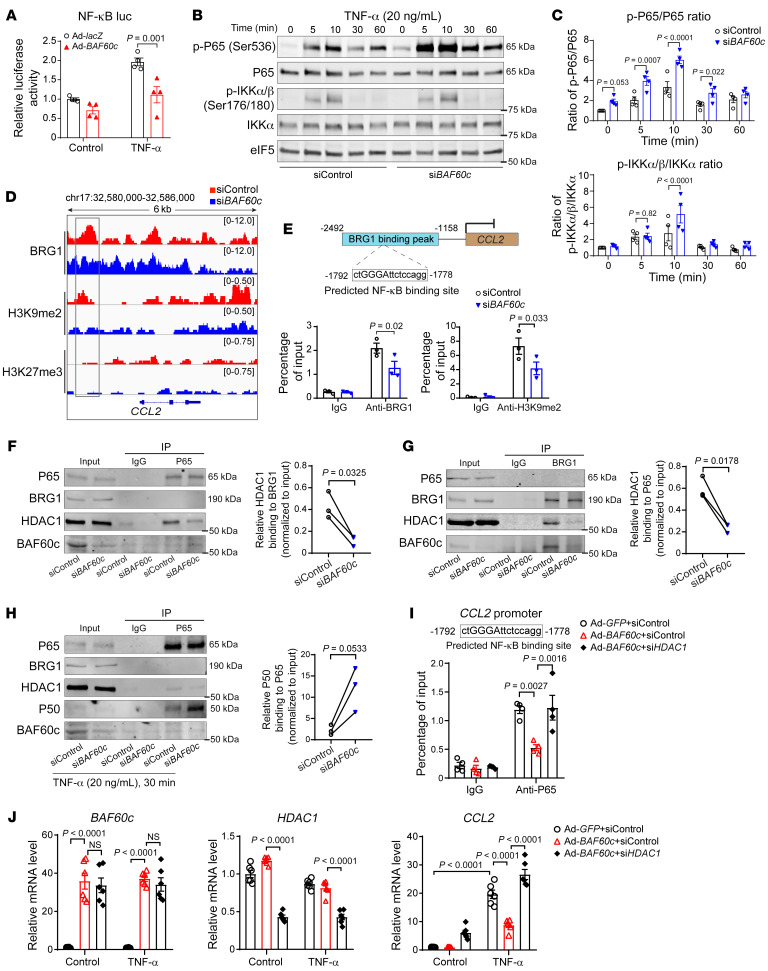
Figure 6. BAF60c knockdown activates the NF-κB pathway.
(A) HASMCs were transfected with the NF-κB response element–derived luciferase reporter. After 8 hours, cells were infected with Ad-lacZ or Ad-BAF60c (10MOI). After 48 hours, cells were stimulated with TNF-α (20 ng/mL) for 12 hours and promoter activity was determined by dual-luciferase assay and normalized against Renilla luciferase activity. (B and C) HASMCs were transfected with siControl or siBAF60c (30 nM). After 48 hours, cells were serum starved in Opti-MEM for 24 hours and then treated with TNF-α (20 ng/mL). (B) Western blot to determine the protein abundance of phosphorylated P65 (p-P65), P65, p-IKKα/β, and IKKα. (C) Quantitative analysis of the ratio of p-P65 to P65 and p-IKKα/β to IKKα in B (n = 3). (D) HASMCs were transfected with siControl or siBAF60c (30 nM). After 48 hours, cells were serum starved in Opti-MEM for 24 hours, and then ChIP-Seq was performed with Abs against BRG1, H3K9me2, and H3K27me3. Normalized ChIP-Seq reads of BRG1, H3K9me2, and H3K27me3 in human CCL2 gene promoter and coding region are shown in IGV image. (E) BRG1 and H3K9me2 binding at the predicted NF-κB–binding site within the CCL2 gene promoter were determined by ChIP assay in HASMCs transfected with siControl or siBAF60c (30 nM) for 48 hours, serum starved for 24 hours, and then treated with TNF-α (20 ng/mL) for 30 minutes. (F, G, and H) HASMCs were transfected with siControl or siBAF60c (30 nM). After 48 hours, cells were serum starved in Opti-MEM for 24 hours and treated with or without TNF-α (20 ng/mL) for 30 minutes, followed by nuclear protein isolation and Co-IP using Abs against P65 or BRG1. IgG served as negative control. (I and J) HASMCs were transfected with siControl or siHDAC1 (30 nM) and infected with Ad-GFP or Ad-BAF60c for 48 hours, serum starved for 24 hours, and then treated with TNF-α (20 ng/mL) for 30 minutes (I) or 24 hours (J). (I) P65 binding at the predicted NF-κB–binding site within the human CCL2 promoter was determined by ChIP assay. Data are from 4 independent experiments. (J) qPCR to determine mRNA levels of BAF60c, HDAC1, and CCL2. Three independent experiments were performed for E–G. Data are represented as mean ± SEM. Two-way ANOVA followed by Holm-Šidák post hoc analysis (A, C, E, I, and J); paired t test (F–H).

