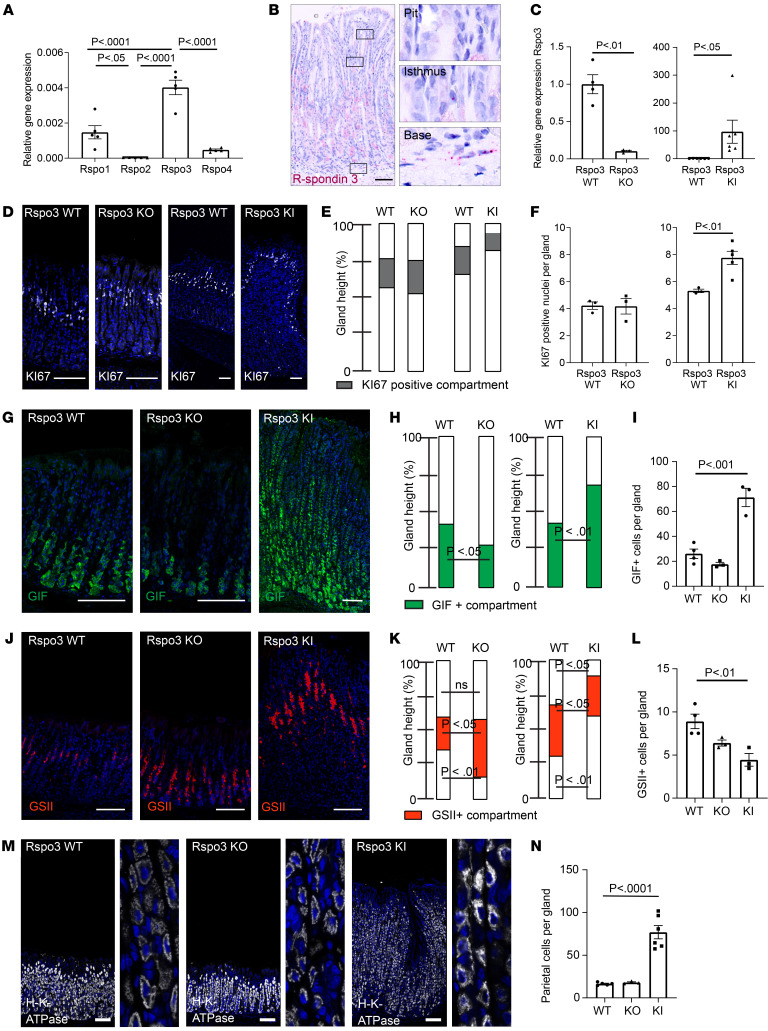
Figure 1. RSPO3 controls secretory cell differentiation in corpus glands.
(A) qPCR for expression of Rspo1–4 in Bl6 mice (n = 4). (B) ISH of Rspo3 (red) in corpus tissue of a nontreated MYH11-CreERT2; Rspo3WT/WT control mouse. (C) qPCR for Rspo3 expression in Rspo3-KO mice (n = 3) versus littermate controls (n = 4) and MYH11CreERT2-Rosa26CagRspo3 (Rspo3 KI) (n = 6) versus littermate controls (n = 6). (D) Immunofluorescence labeling for Ki67 (white) representative of Rspo3-KO and Rspo3-KI mice and littermate controls. (E) Location and relative size of the Ki67-positive gland compartment. (F) Quantification of the number of Ki67+ nuclei per gland in Rspo3-KO and Rspo3-KI mice and corresponding littermate controls (n = 3 mice per group). (G) Immunofluorescence labeling for GIF (green) representative of Rspo3-KO and Rspo3-KI mice and littermate controls. (H) Location and relative size of GIF-positive gland compartment. (I) Quantification of the number of GIF+ cells per gland in Rspo3-KO and Rspo3-KI mice and corresponding littermate controls (n = 3 mice per group). (J) Immunofluorescence labeling for GSII (red) representative of Rspo3-KO and Rspo3-KI mice and littermate controls. (K) Location and relative size of the GSII-positive gland compartment. (L) Quantification of the number of GSII+ cells per gland in Rspo3-KO and Rspo3-KI mice and corresponding littermate controls (n = 3 mice per group). (M) Immunofluorescence images of H/K-ATPase labeling (gray) in sections representative of Rspo3-KO and Rspo3-KI mice and corresponding littermate controls. (N) Quantification of parietal cells per gland in Rspo3-KO and Rspo3-KI mice and corresponding littermate controls (n = 3 mice per group). Mice were treated with tamoxifen 2 weeks before euthanasia. Scale bars: 100 μm. Enlargements in M equal 8:1 magnification. Unpaired parametric t test (C, E, F, H, and K); 1-way ANOVA with Tukey’s multiple-comparison test (A, I, and L).

