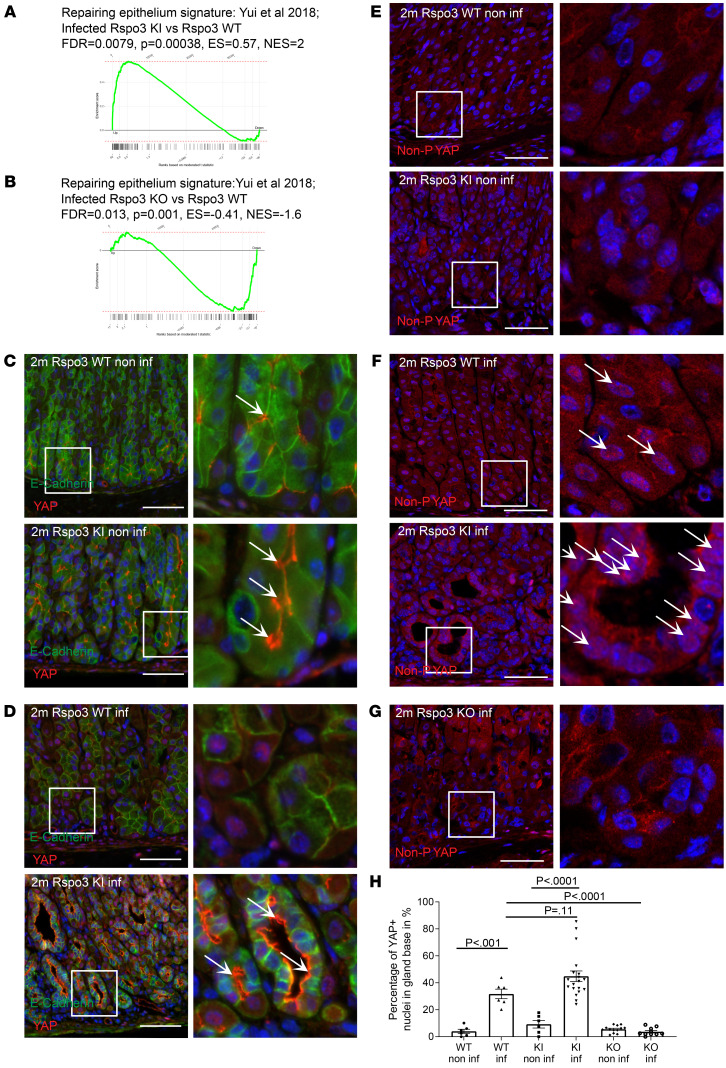
Figure 7. Gland cells express YAP, which upon infection with H. pylori, is translocated to the nucleus.
(A and B) GSEA of microarray data comparing the expression profile of the corpus tissue from (A) 2-month–infected Rspo3-KI mice and infected littermate controls treated with tamoxifen 2 months before euthanasia, (B) 2-month–infected Rspo3-KO mice and infected littermate controls treated with tamoxifen 2 months before euthanasia with a published data set for repairing epithelium signature (22). (C and D) Representative immunofluorescence images of costaining for YAP (red) and E-cadherin (green) of sections from (C) noninfected and (D) infected Rspo3-KI and Rspo3-WT mice. Arrows show cytoplasmatic YAP. (E–G) Representative immunofluorescence images of nonphosphorylated (=active nuclear) YAP (red) of sections from (E) noninfected, (F) infected Rspo3-WT, and Rspo3-KI mice, and (G) infected Rspo3-KO mice. (H) Percentage of epithelial YAP+ nuclei (costained with E-cadherin) in the gland bases of sections from noninfected and 2-month–infected Rspo3-KI, Rspo3-KO, and Rspo3-WT mice. For GSEA, n = 2 mice per group. Scale bars: 50 μm. One-way ANOVA with Tukey’s multiple-comparison test.

