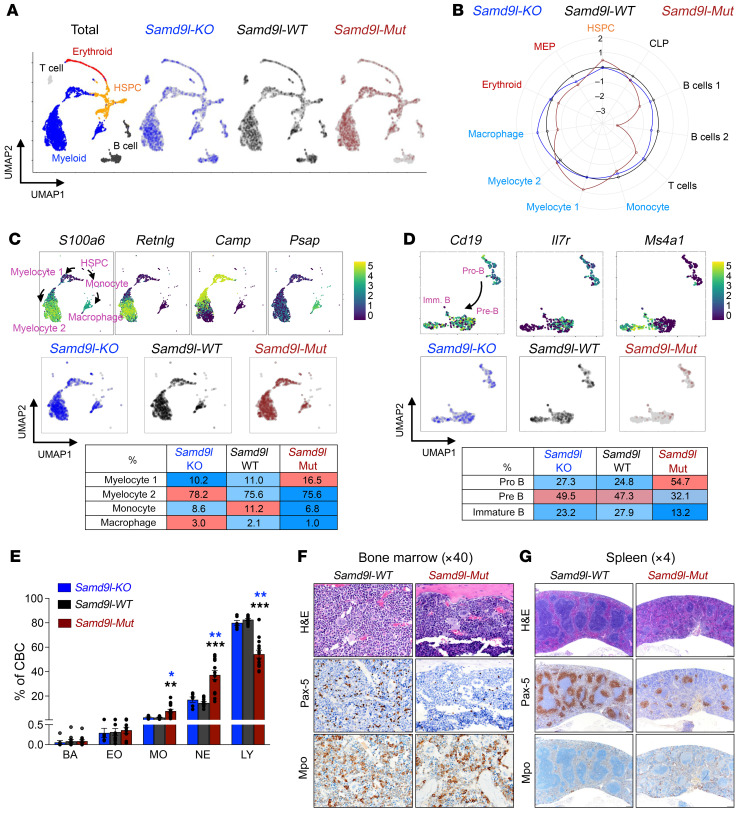
Figure 2. Mutant Samd9l expression skews murine hematopoietic lineage profiles.
(A and B) scRNA-seq of Samd9l-KO (n = 1,495), Samd9l-WT (n = 1,498), and Samd9l-Mut (n = 1,436) mice from a single experiment. (A) Uniform manifold approximation and projection (UMAP) plots of scRNA-seq data. Eleven clusters were identified according to established marker expression and consolidated into 5 main populations as annotated. (B) A circular plot showing the proportion of the identified 11 clusters in each group relative to Samd9l-WT control. (C) Myeloid cell differentiation trajectories based on reported markers, including S100a6, Retnig, Camp, Psap, and others on the scRNA-seq UMAP plot (top panel) and the percentage of cells in each cluster (middle and bottom panels) from Samd9l-KO, Samd9l-WT, and Samd9l-Mut mice. The colors of each dot represent the normalized expression level of genes indicated above. (D) B cell differentiation trajectory based on established markers, including Cd19, Il7r, and Ms4a1 (encodes CD20 protein) (top panel) and the percentage of cells in each cluster (middle and bottom panels) from Samd9l-KO, Samd9l-WT, and Samd9l-Mut mice. (E) CBC of Samd9l-KO (n = 6), Samd9l-WT (n = 11), and Samd9l-Mut (n = 14) mice at 3 months of age showing neutrophils (NEs), monocytes (MOs), eosinophils (EOs), basophils (BAs), and lymphocytes (LYs). (F and G) Histological assessment of BM (F, ×40 magnification) and spleen (G, ×4 magnification) sections from 3-month-old Samd9l-WT or Samd9l-Mut. Sections were stained with modified Romanowsky stain for morphological assessment and IHC labeling was done using anti–PAX-5 (B cells) or anti-MPO (myeloid cells). For panel E, groups were initially compared by Kruskal-Wallis test. Significant Kruskal-Wallis results were followed by pairwise comparisons with Wilcoxon’s rank-sum test. *P < 0.05, **P < 0.01, ***P < 0.001. Error bars indicate the SEM for biological replicates.

