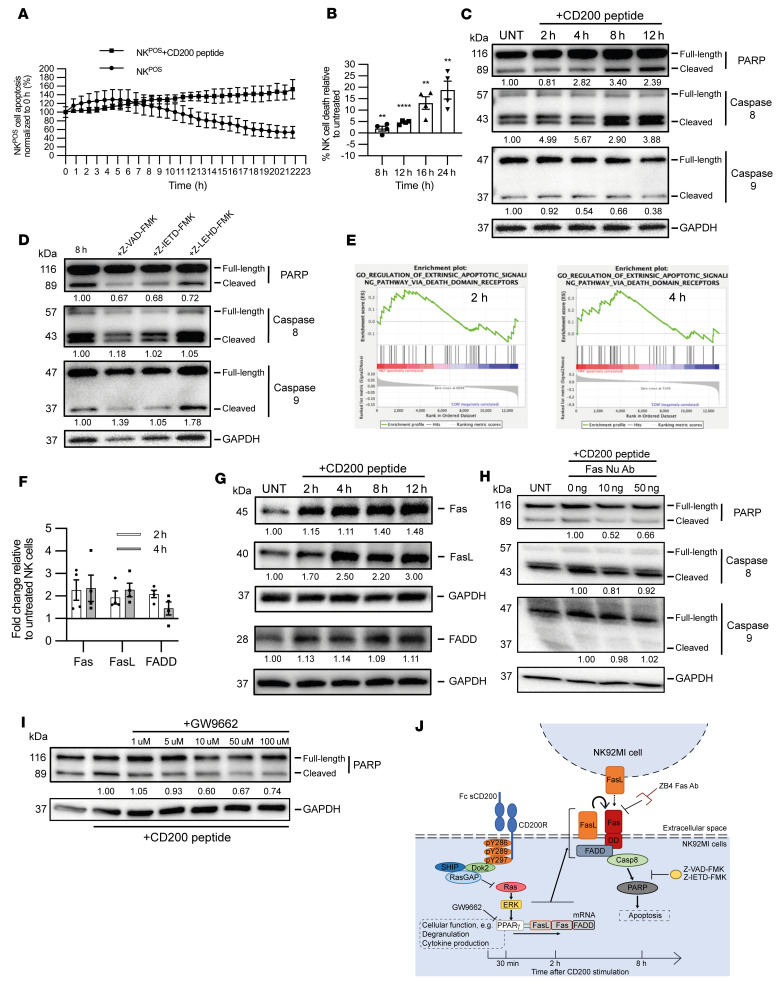
Figure 4. CD200 induced NK cell apoptosis.
(A) Untreated (UNT) and CD200 peptide–treated NKPOS cells observed for apoptotic events by IncuCyte caspase 3 assay. (B) Apoptosis frequency between untreated and CD200 peptide–treated NKPOS cells was determined as a ratio of viability at 8, 12, 16, and 24 hours. (C) Immunoblots from untreated and CD200 peptide–treated NKPOS cells for various time points probed for PARP, caspase 8, caspase 9, and GAPDH. (D) Immunoblots for PARP, caspase 8, caspase 9, and GAPDH from untreated and CD200 peptide–treated (8 hours) NKPOS cells exposed to caspase inhibitors Z-VAD-FMK (pan), Z-IETD-FMK (caspase 8), and Z-LEDH-FMK (caspase 9). (E) Gene set enrichment plots obtained from differentially expressed genes from NKPOS cells incubated with CD200 peptide for 2 and 4 hours compared to untreated cells. (F) qPCR of NKPOS cells for Fas, FasL, and FADD genes after 2-hour or 4-hour CD200 peptide incubation relative to untreated. Expression was normalized to β-actin. Fold change was calculated relative to untreated NK cells according to the 2–ΔΔCt method. (G) Immunoblots from untreated and CD200 peptide–treated NKPOS cells at various time points probed for Fas, FasL, FADD, and GAPDH. (H) Immunoblots for PARP, caspase 8, caspase 9, and GAPDH from untreated and CD200 peptide–treated (8 hours) NKPOS cells also exposed to anti-Fas monoclonal antibody (clone ZB4) at increasing concentrations. (I) Immunoblots for PARP and GAPDH from untreated and CD200 peptide–treated (8 hours) NKPOS cells also exposed to GW9662 at increasing concentrations. (J) Schematic summary of CD200-induced apoptosis. Western blot quantification is shown as a mean of 3 independent experiments. Data are presented as mean ± SD of 3 independent experiments. **P < 0.01; ****P < 0.0001 by 2-way ANOVA with Bonferroni’s post hoc test.

