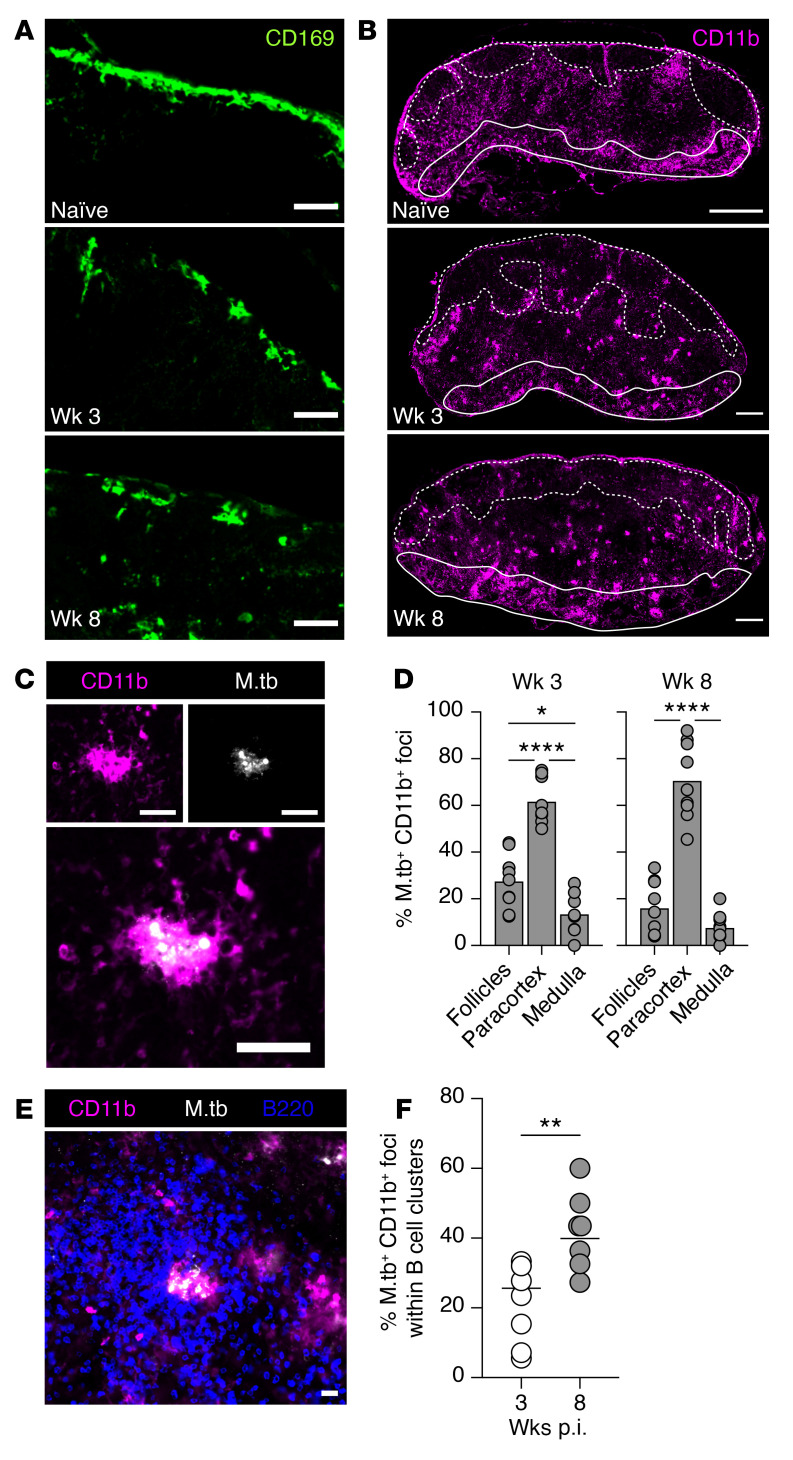
Figure 4. M. tuberculosis is mainly contained in CD11b+ myeloid cells within paracortical B cell clusters.
(A and B) Immunofluorescence images of mLN from naive and week 3 and 8 M. tuberculosis–infected mice stained for CD169 (A) (scale bars: 50 μm) and CD11b (B) (scale bars: 300 μm). Dashed white line delineates B cell follicles, and solid white line defines the medulla. (C) Representative immunofluorescence staining of CD11b+ myeloid cells and M. tuberculosis bacteria. Scale bars: 50 μm. (D) Quantification of CD11b+M. tuberculosis+ foci in the subcompartments of the mLN at weeks 3 and 8 after M. tuberculosis infection. The analysis was performed on stitched images of entire mLN, and subcompartments of the mLN were defined as indicated in Figure 2B, top panel. (E) Representative image of CD11b+M. tuberculosis+ foci localized within B cell cluster in the paracortex. Scale bar: 50 μm. (F) Quantification of CD11b+M. tuberculosis+ foci within B cell clusters in the paracortex of whole mLN sections at weeks 3 and 8 after M. tuberculosis infection. Circles and bars denote the individual mLN sections and group means, respectively. Data shown in D and F are pooled from 3 independent experiments (n = 7–9 mice in total). Statistical differences between groups were determined using 1-way ANOVA with Tukey’s multiple-comparison test (D) or Student’s t test (F). *P < 0.05, **P < 0.01, ****P < 0.0001.

