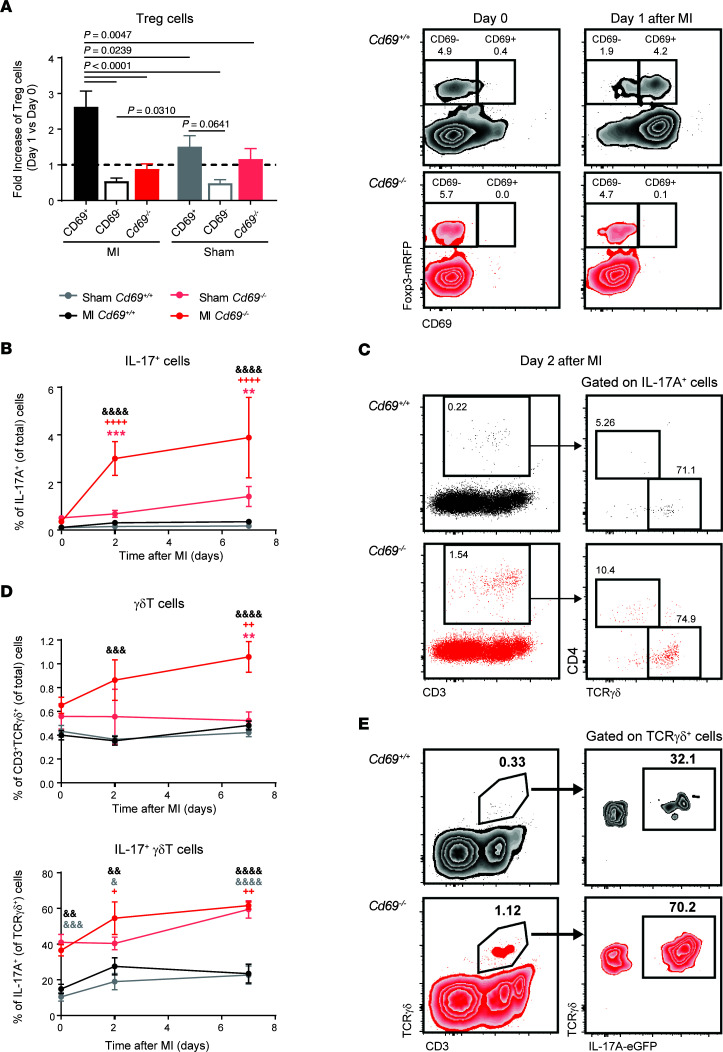
Figure 3. Treg and IL-17A responses in the blood of mice after LAD ligation.
(A) Fold increase of the percentages of wild-type CD69+ Tregs, wild-type CD69– Tregs, and Cd69–/– Tregs among CD4+ cells in peripheral blood 1 day after LAD ligation or sham surgery, compared with the percentages on day 0 (dotted line). Representative density plots of Tregs on day 0 and day 1 after MI are shown on the right (n = 10–20). Histograms indicate the mean ± SEM, and data were analyzed by 1-way ANOVA with Tukey’s post hoc test. (B) Kinetics of IL-17A+ cells in peripheral blood after surgery, expressed as a percentage of total cells. (C) Left: Representative dot plots of IL-17A+ cells, with the percentages of total cells indicated in the outlined box. Right: Representative dot plots showing the main cell populations positive for IL-17A. (D). Kinetics of the percentages of γδT cells and IL-17+ γδT cells in peripheral blood after LAD ligation or sham surgery. (E) Representative density plots of γδT cells in peripheral blood, with the percentages of cells indicated in the outlined box. Data in B and D are representative of 4 independent experiments and indicate the mean ± SEM (n = 6–10). Statistical significance was analyzed by 2-way ANOVA with Šidák’s multiple-comparison test. Asterisks denote differences between MI and sham-operated mice (light gray for Cd69+/+ mice, light red for Cd69–/– mice); ampersands denote differences between Cd69+/+ and Cd69–/– MI mice; plus signs denote differences between each day and day 0. +/&P < 0.05, **/++/&&P < 0.01, ***/&&&P < 0.001, and ++++/&&&&P < 0.0001.

