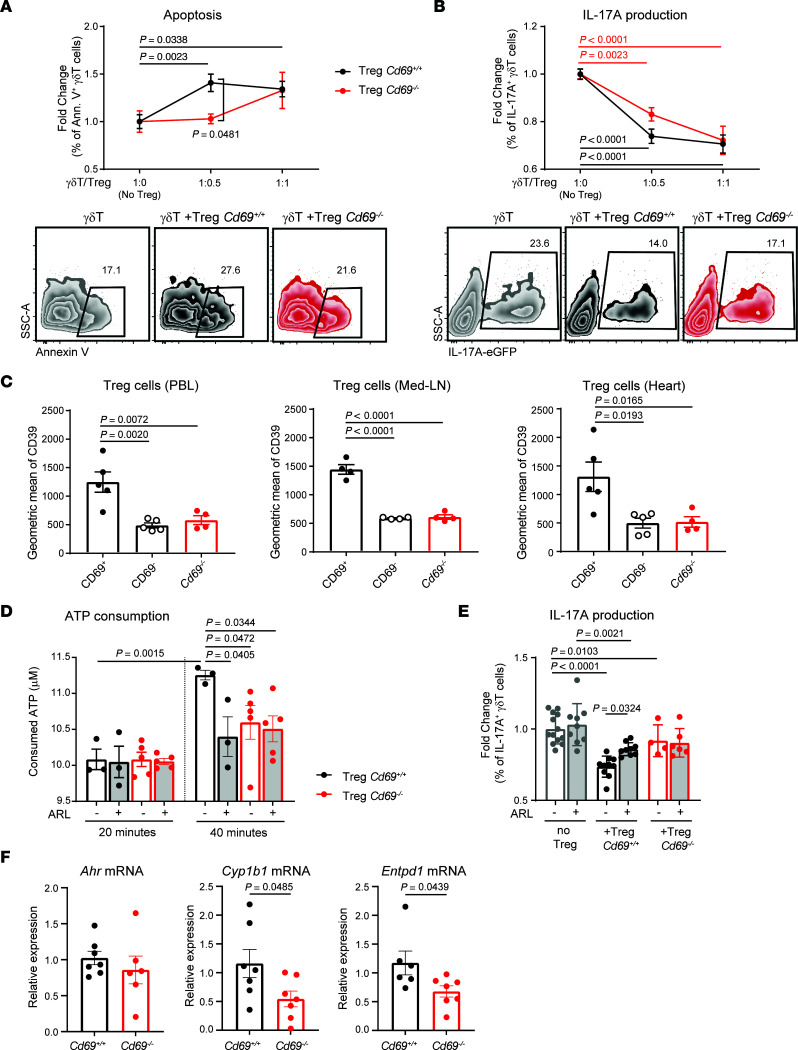
Figure 5. Expression of CD39 by CD69+ Tregs after MI mediates the inhibition of γδΤ cells.
(A) Sorted wild-type γδT cells were cocultured for 24 hours with Cd69+/+ or Cd69–/– sorted Tregs at the indicated γδT/Treg ratios. Apoptosis of γδT cells, represented as the fold increase of annexin V+ (Ann. V+) γδT cells versus γδT cells alone (ratio 1:0) (n = 4–10). A representative zebra plot of the 1:0.5 ratio, gated on γδT cells is shown. (B) Inhibition of IL-17A production by γδT cells, plotted as the fold change of IL-17A+ γδT cells for each ratio versus the 1:0 ratio (n = 6–12). Representative zebra plots of the 1:0.5 ratio, gated on γδT cells, are shown. Data in A and B were pooled from 4 independent experiments. Data indicate the mean ± SEM. Statistical significance was determined by 2-way ANOVA with Sidak’s multiple-comparison test. Significant P values are shown (black for Cd69+/+ Tregs and red for Cd69–/– Tregs). (C) CD39 expression on Tregs in PBLs, mediastinal lymph nodes (Med-LN), and heart was measured by FACS, 2 days after MI (n = 4–5). Data indicate the mean ± SEM. Statistical significance was determined by 1-way ANOVA with Tukey’s post hoc test. (D) Extracellular ATP was measured in the supernatant of isolated Tregs, in the presence or absence of ARL 67156 (ARL) at the indicated time points after ATP supplementation (n = 3–5). Data are from 1 representative independent experiment of 4 experiments and indicate the mean ± SEM. Statistical significance was determined by mixed-effects 2-way ANOVA with Šidák’s multiple-comparison test. (E) IL-17A production by sorted γδT cells in the presence of Tregs and/or ARL 67156, fold change versus the percentage of IL-17A+ γδT cells alone (n = 3–7). Data are representative of 3 independent experiments and indicate the mean ± SEM. Statistical significance was determined by 2-way ANOVA with Šidák’s multiple-comparison test. (F) Quantification of Ahr, Cyp1b1, and Entpd1 mRNA levels in Tregs by qPCR (n = 6–7). Data were pooled from 2 independent experiments and represent the mean ± SEM. Statistical significance was determined by unpaired Student’s t test.

