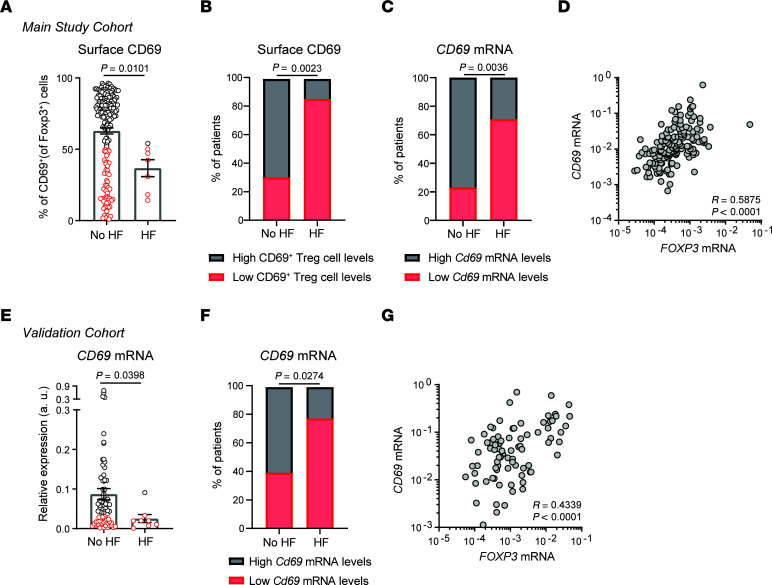
Figure 7. High CD69 expression in patients early after MI is associated with a decreased risk of developing HF.
(A) After 2.5 years of clinical follow-up, patients from the main study cohort were stratified according to whether or not they developed HF. CD69 expression on Tregs at the time of hospital admission for acute MI in patients who developed HF (n = 7) or did not develop HF (n = 180). Data were analyzed by Mann-Whitney U test. (B) Percentage of patients with low or high levels of surface CD69 expression on Tregs, measured by FACS in the main study cohort. The P value was calculated using a χ2 test. (C) Frequency of patients with low or high levels of CD69 mRNA expression, measured by qPCR in the main study cohort (the mean normalized CD69 2–ΔCt values were used to discriminate patients expressing low or high levels of CD69). (D) Correlation of FOXP3 and CD69 mRNA expression in PBLs from individuals in the main study cohort. Spearman’s correlation coefficient (r) and P values are shown. (E) CD69 mRNA levels measured by qPCR in total PBLs from the independent validation cohort of patients (n = 75 with no HF and n = 9 with HF). Data were analyzed by Mann-Whitney U test. (F) Frequency of patients with low or high levels of CD69 mRNA, measured by qPCR in the validation cohort (the mean normalized CD69 2–ΔCt values were used to discriminate patients with low or high CD69 expression). The P value was calculated using a χ2 test. (G) Correlation of FOXP3 and CD69 mRNA expression in PBLs from individuals in the validation cohort. Spearman’s correlation coefficient (r) and P values are shown.

