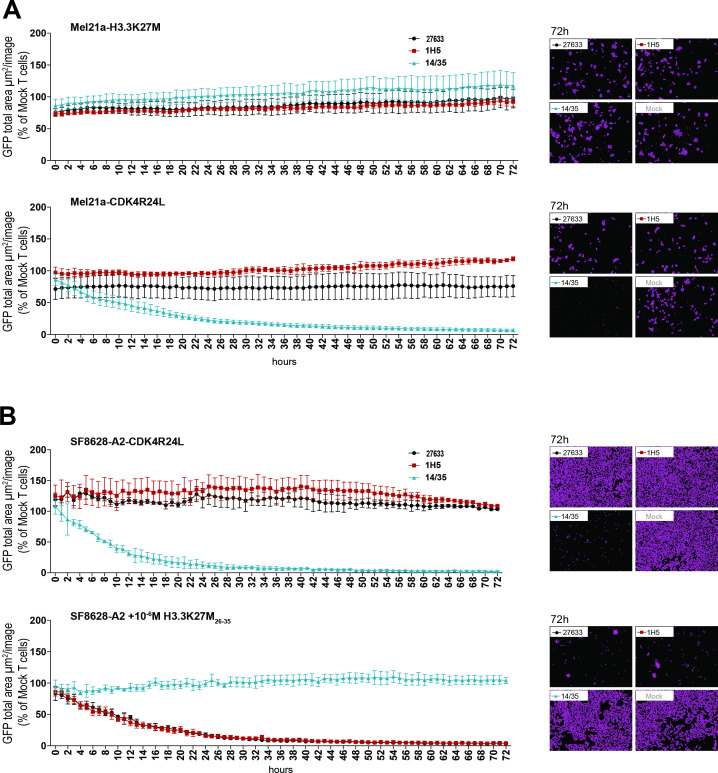
Figure 3.
Lack of cytotoxicity against cells naturally expressing or overexpressing mutant H3.3 histone. (A) 15×103 transduced CD8+ cells were cocultured at a 5:1 E:T ratio with HLA-A*02:01+ Mel21a cells, retrovirally transduced to express either H3.3K27M full length cDNA (MP71_H3.3K27M-CDS-P2A-GFP) (top panel) or CDK4R24 full length cDNA (MP71-CDK4-R24L-P2A-GFP) (bottom panel). Cytotoxicity was observed over 72 hours using the live cell imaging system IncuCyte Zoom (Essen bioscience). Representative images are shown in the right panels. Values are calculated by normalizing the average GFP total area (µm²/image) in the target cells cocultured with the respective TCR-transduced T cells to the average of that cocultured with mock transduced T cells. The experiment was performed three times with similar results and graphs represent means of triplicate cultures±SD. (B) 15×103 CD8+ transduced cells were cocultured at a 5:1 E:T ratio with SF8628-A2 cells, naturally expressing the H3.3K27M mutation and additionally either retrovirally transduced to express CDK4R24L full length cDNA (top panel) or loaded with 10-6 M mutant H3.3K27M peptide (bottom panel). Cytotoxicity was observed over 72 hours using the live cell imaging system IncuCyte Zoom. Representative images are shown in the right panels. Values are calculated as in (A). The experiment was performed three times with similar results and graphs represent means of triplicate cultures±SD. GFP, green fluorescent protein.

