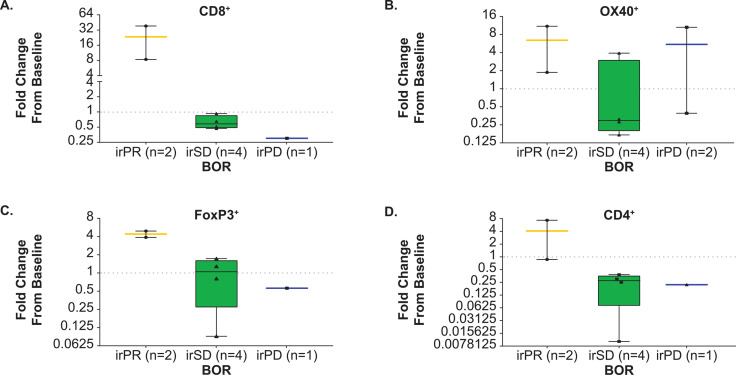
Figure 3.
Fold-change from baseline in the percentage of immune cell types. Data are represented as the fold-change from baseline in the percent of each immune cell type, comparing the 6 weeks sample to baseline, and grouped by BOR using irRECIST criteria. The dashed horizontal line represents no change from baseline. One patient with baseline/on-treatment biopsies from different tumor sites and one patient with an indeterminate BOR were excluded from graphed analyses. For one patient with a BOR of irPD, data were evaluable for the OX40 measurement only. Paired biopsies were obtained from two patients with a BOR of irPR. Flagship automated tissue analysis was performed using the CellMap0.8 software platform. The 4 µM slides were stained with an anti-CD4 antibody from Leica, clone NCL-L-CD4-368; anti-CD8 antibody from Dako, clone M7103; anti-FOXP3 antibody from Abcam, clone ab20034; and anti-OX40 antibody from BD Bioscience, #555 836. BOR, best overall response; ir, immune-related; PD, progressive disease; PR, partial response; RECIST, Response Evaluation Criteria in Solid Tumors; SD, stable disease.

