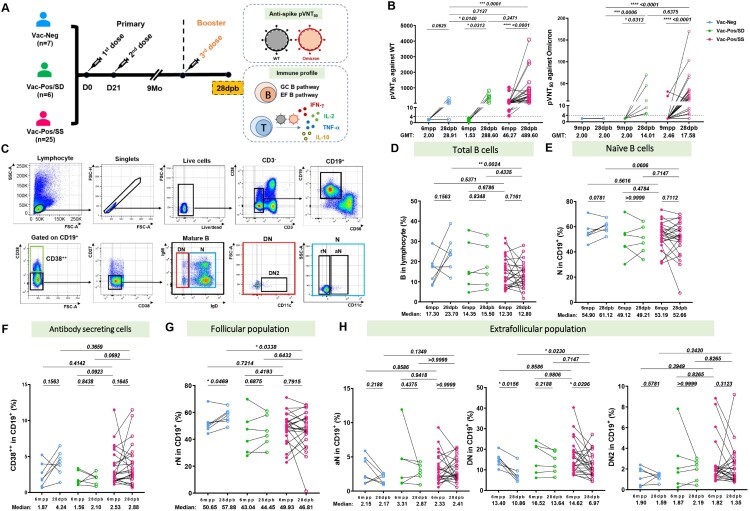
Figure 3.
B cell differentiation profiles before and after booster BBIBP-CorV vaccination. (A) Diagram of the booster regimen. n = 25 Vac-Pos/SS, n = 6 Vac-Pos/SD, n = 7 Vac-Neg were included in the immune profile analysis at 28 days after the booster programme (28dpb). All participants were boosted at 9 months after the completion of the 2-dose BBIBP-CorV vaccination. (B) Comparison of neutralizing antibody levels against WT (left) and Omicron (right) strains in participants who received booster vaccination before (6 mpp) and after booster vaccination (28 dpb). GMTs are indicated above the graph. The dotted line indicates the lowest serum dilution (1:4). (C) Gating strategy of flow cytometry data for different B cell subpopulations. (D-E) Percentages of total CD19+ B cells and naïve B cells in Vac-Neg, Vac-Pos/SS, and Vac-Pos-SD groups before (6mpp) and after (28dpb) booster vaccination. (F-H) Frequencies of CD38+ (F), resting naïve (rN) B cells (G) and extrafollicular population (H), including activated naïve (aN), CD27-IgD- (double negative, DN), and CD11c+ DN (DN2) cells in CD19+ B cells before (6mpp) and after (28dpb) booster vaccination. Data were represented as median with interquartile range (IQR). P value was determined by paired t-test.

