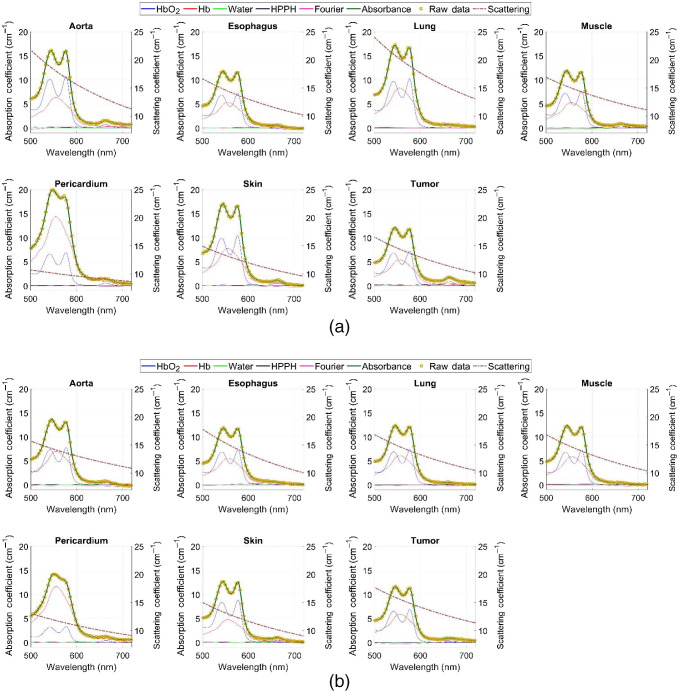
Fig. 2.
Typical total reflectance spectra of components, fit, and raw data measured from various tissue types, tumor tissue, and pleural sites during (a) pre-PDT and (b) post-PDT conditions. Absorbance raw data are yellow circular markers. Solid lines correspond to components included in analysis (including Fourier components) and fit. Each component and the fit are individually colored. Additionally, mean fit scattering spectra is included as the dashed line, with the right axis corresponding to the reduced scattering coefficient () values.

