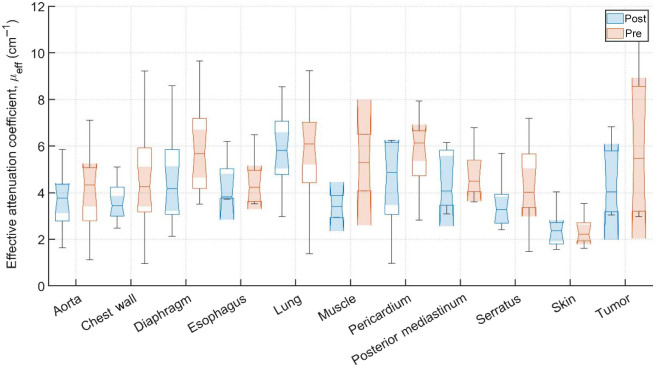
Fig. 5.
Effective attenuation coefficients, , () for various tissues and pleural sites. The results are expressed as median values (center horizontal lines within boxes), the 95% CI (shaded notch region), IQR (entire box), non-outlier (defined as values contained within the ) maximum and minimum values (horizontal whiskers), for pre-PDT and post-PDT conditions at 665 nm, obtained from diffuse spectral measurement analysis.

