. 2022 Oct 31;12(48):31068–31082. doi: 10.1039/d2ra05127c

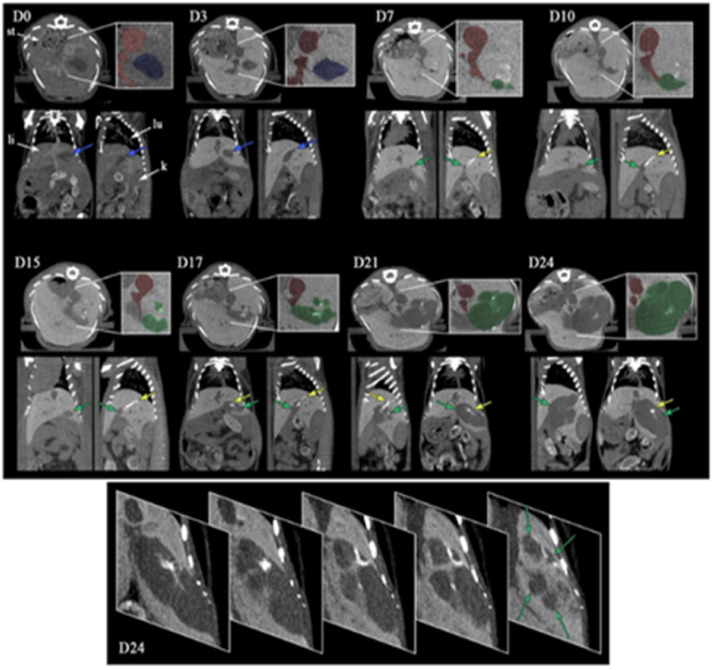
Fig. 3. Micro-CT imaging of tumor-bearing mice after intrahepatic injection of α-tocopherol nanoemulsion and the pictures report maximum intensity projection of transverse section, sagittal and coronal section of the liver, for 0, 3, 7, 10, 15, 17, 21 and 24 days after injection of the cells and iodinated nano-emulsions as contrast agent. At D0, are indicated in the figure the localizations of the stomach (st), liver (li), lung (lu) and kidney (k). Insets show details with colored filters that guide the eye to differentiate the vascularization (in red), cell injection cavity (in blue),and tumor (in green), completed by arrows in the other views. Yellow arrows point out the hyper-contrast zones that appear during the tumor growth. The bottom part, at D24, shows transverse sections of tumor for different depths, emphasizing the different tumor nodules with green arrows.

Fig. 3