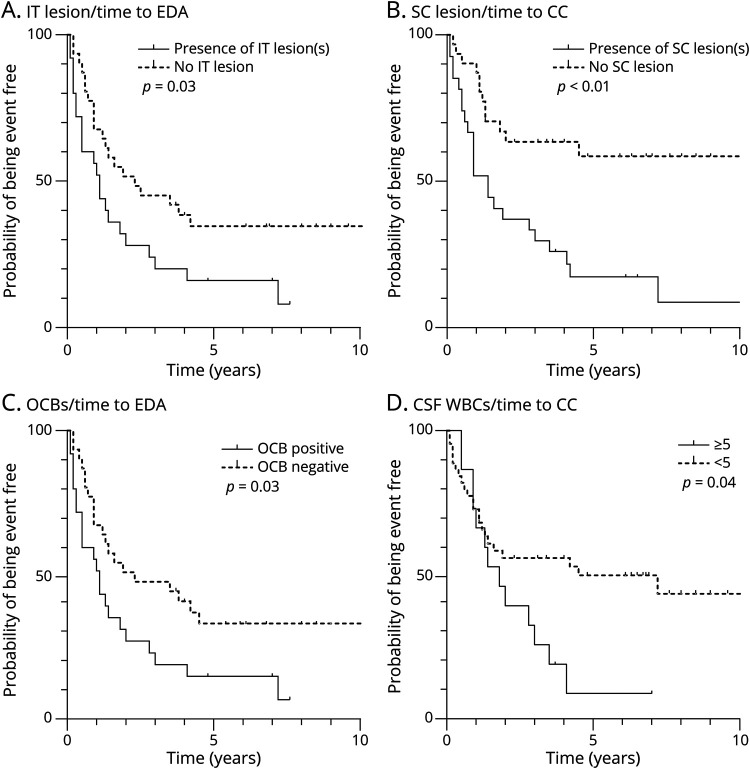
Figure 2. Survival Curves for Evidence of Clinical Activity and Clinical Conversion According to Brain MRI and OCBs.
Kaplan-Meier estimates of the probability of EDA and CC during follow-up are depicted as a function of the presence of IT lesions (A), SC lesions (B), the presence of OCBs (C), high levels of WBCs (D). CC = clinical conversion; EDA = evidence of disease activity; IT = infratentorial; OCBs = oligoclonal bands; SC = spinal cord; WBCs = white blood cells.

