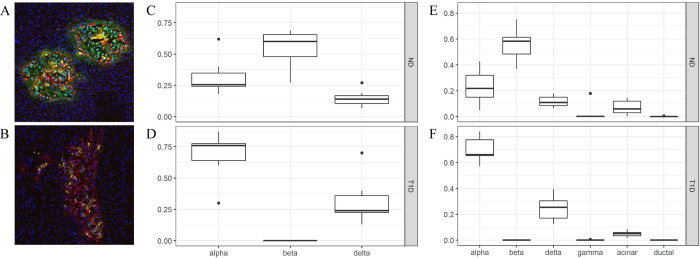
Fig 1. The proportion of different endocrine cells in islets.
Images of representative islets, where the composition of islet cells based on immunofluorescent triple-staining of glucagon (red), insulin (green) and somatostatin (yellow) to represent alpha-, beta- and delta cells respectively, is shown in non-diabetic subjects (A) and T1D subjects (B). Tukey box-plots of the histologically determined endocrine area proportion in non-diabetic subjects (C) and T1D subjects (D). Proportions of the area sum to one per sample. Multi-subject Single Cell (MuSiC) utilizes cell-type specific gene expression from single-cell RNA sequencing data to characterize cell type compositions from bulk data. Deconvolution of the bulk data into alpha, beta, gamma, delta, acinar and ductal cells in the different tissues is illustrated in non-diabetic subjects (E) and T1D subjects (F). Proportions sum to one per sample and the data is illustrated in a Tukey boxplot. ND: Non-diabetic subjects, T1D: Type 1 diabetic subjects.

