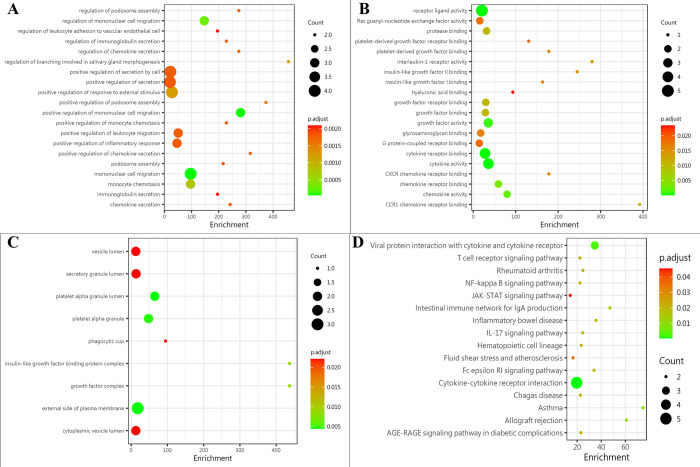
Fig 3. Protein function analysis of identified biomarkers.
(A) top 20 significantly enriched biological process of identified biomarkers; the X-axis represents the enrichment, while the Y-axis represents the biological process. (B) the molecular function enriched by identified biomarkers; the X-axis represents the enrichment, while the Y-axis represents the molecular function. (C) the cellular component enriched by identified biomarkers; the X-axis represents the enrichment, while the Y-axis represents the cellular component. (D) the pathway enriched by identified biomarkers; the X-axis represents the enrichment, while the Y-axis represents the pathway. The deeper the color, the larger the P value; the larger the circle, the bigger the counts.

