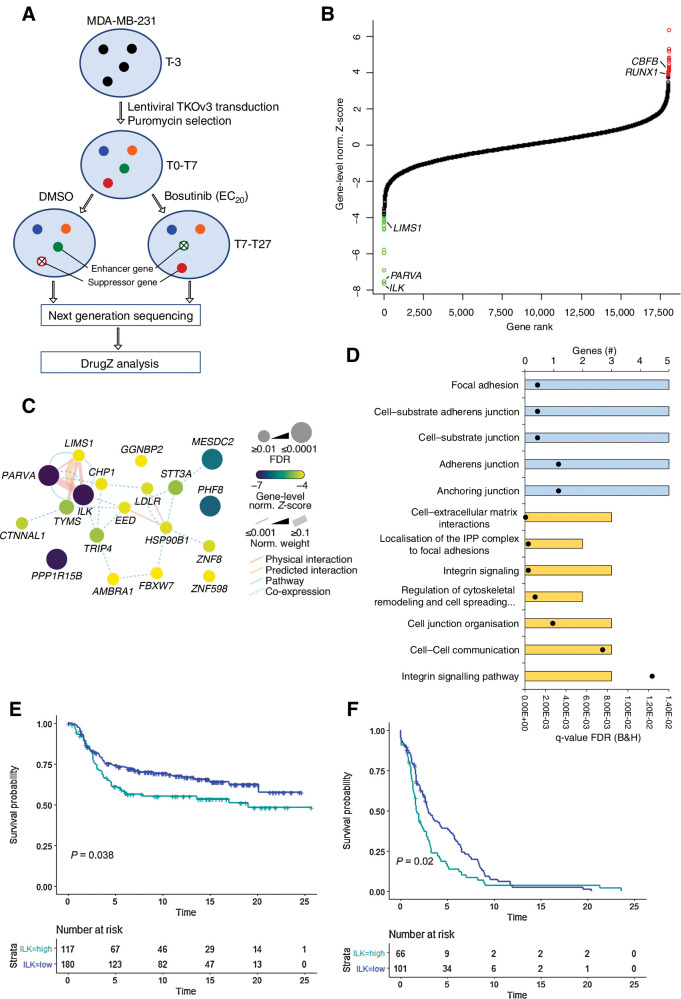
Figure 2.
The ILK–Parvin–PINCH complex is the top enhancer of bosutinib-induced cell growth inhibition. A, Overview of the genome-wide CRISPR-Cas9 knockout screen in MDA-MB-231 cells. T0, initial time point immediately after puromycin selection; T7, 7 days post puromycin selection; T19, three rounds of drug treatment; T27, five rounds of drug treatment. B, DrugZ analysis of the genome-wide bosutinib CRISPR-Cas9 screen. The gene-level normalized Z-score from the T27 time point is shown. Genes are ranked according to the enhancer genes. The Benjamini and Hochberg FDR was used to calculate significance. Green data points are enhancer genes with FDR < 0.05 and red are suppressor genes with FDR < 0.05. C, Network map for the enhancer genes identified at T27. Network edges were weighted according to evidence of cofunctionality using GeneMANIA in Cytoscape. D, ToppGene gene ontology analysis for the combined T19 and T27 enhancer genes. Blue, cellular component category; yellow, pathway category. Black dots, q values. E, High ILK expression correlates with worse survival. Kaplan Meier plot for the METABRIC TNBC subtype. The optimal threshold for dichotomisation of the datasets into high and low ILK expression was identified using the survivALL R package and “plotALL” function for multicut point analysis using the METABRIC dataset. F, Kaplan–Meier plot for the TCGA-PanCancer basal subtype used as a validation dataset. Breast cancer-specific survival was used.

