. 2021 Dec 17;82(4):632–647. doi: 10.1158/0008-5472.CAN-21-0373

Figure 3.

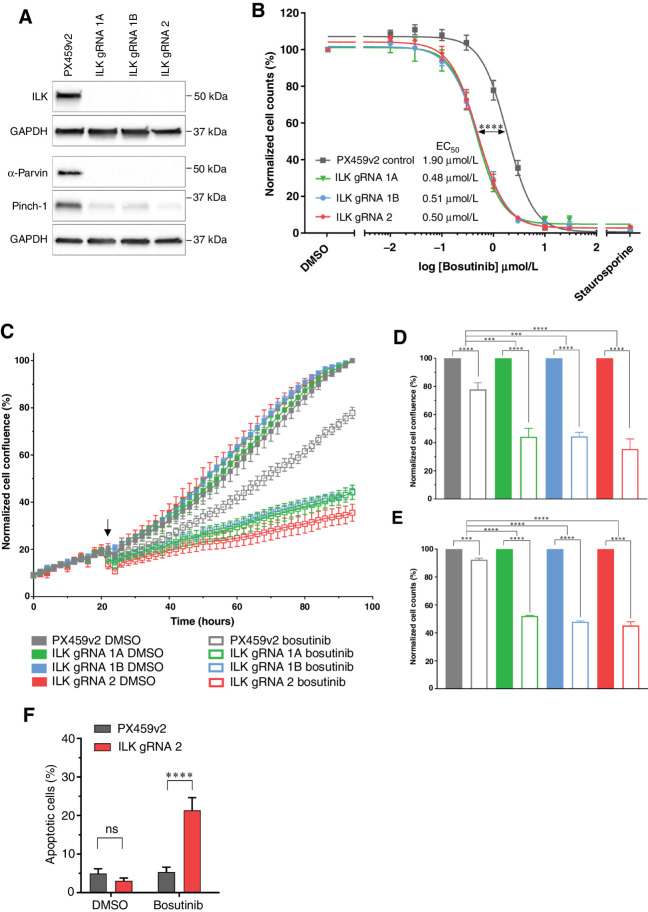
Figure 3. Loss of the ILK–Parvin–PINCH complex potentiates the effects of bosutinib in MDA-MB-231 cells. A, CRISPR-Cas9 targeting ILK results in ILK loss in the MDA-MB-231 cell line as assessed by Western blot. B, Bosutinib 8-point dose response curves using normalized cell counts form Hoechst-stained images. Significance test refers to EC50 values calculated in Prism. C–G) Cells were treated with the EC20 for bosutinib (0.9 μmol/L). C, ILK loss potentiates bosutinib inhibition in real-time assays. Cells were seeded in 96-well plates at 8,000 cells/well and transferred to the IncuCyte Zoom. Arrow shows drug addition at 24 hours post seeding. D, Endpoint quantification using normalized cell confluence from the IncuCyte software. E, Endpoint quantification using normalized cell counts form Hoechst-stained images. F, Apoptosis assay using CellEvent Caspase 3/7 and fluorescence-activated cell sorting. All data shown are the mean of at least three independent experimental replicates. ns, nonsignificant; ***, P < 0.001; ****, P < 0.0001, as determined by a two-way ANOVA with Bonferroni multiple comparisons correction. All error bars are SEM. PX459v2, empty-gRNA CRISPR control cells; gRNA 1A, gRNA 1B and gRNA 2, ILK knockout clones.

Loss of the ILK–Parvin–PINCH complex potentiates the effects of bosutinib in MDA-MB-231 cells. A, CRISPR-Cas9 targeting ILK results in ILK loss in the MDA-MB-231 cell line as assessed by Western blot. B, Bosutinib 8-point dose response curves using normalized cell counts form Hoechst-stained images. Significance test refers to EC50 values calculated in Prism. C–G) Cells were treated with the EC20 for bosutinib (0.9 μmol/L). C, ILK loss potentiates bosutinib inhibition in real-time assays. Cells were seeded in 96-well plates at 8,000 cells/well and transferred to the IncuCyte Zoom. Arrow shows drug addition at 24 hours post seeding. D, Endpoint quantification using normalized cell confluence from the IncuCyte software. E, Endpoint quantification using normalized cell counts form Hoechst-stained images. F, Apoptosis assay using CellEvent Caspase 3/7 and fluorescence-activated cell sorting. All data shown are the mean of at least three independent experimental replicates. ns, nonsignificant; ***, P < 0.001; ****, P < 0.0001, as determined by a two-way ANOVA with Bonferroni multiple comparisons correction. All error bars are SEM. PX459v2, empty-gRNA CRISPR control cells; gRNA 1A, gRNA 1B and gRNA 2, ILK knockout clones.