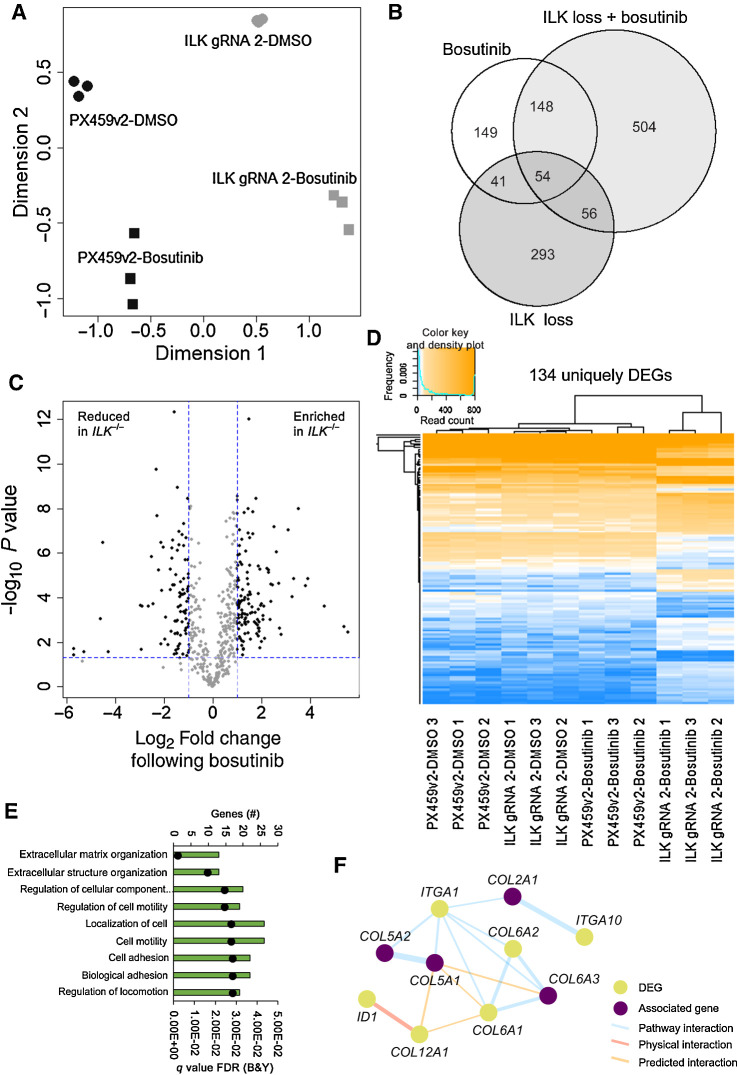
Figure 5.
ILK loss in combination with bosutinib treatment results in differentially expressed genes. A, Principal component analysis using the Limma R package. B, Venn diagram of differentially expressed genes. A cutoff of FDR (Benjamini and Hochberg) P value adjustment <0.05 and a log2-fold change of ±1 was used for the differential expression analysis (DEA). Bosutinib EC20 (0.9 μmol/L) used. Bosutinib DEA: PX459v2-DMSO versus PX459v2-bosutinib; ILK loss DEA: PX459v2-DMSO versus ILK gRNA 2-DMSO; ILK loss + bosutinib DEA: ILK gRNA 2-DMSO versus ILK gRNA 2-bosutinib. Venn diagram created using the VennDiagram R package. C, Volcano plot of the 504 differentially expressed genes unique to ILK gRNA 2-bosutinib samples shown in B. The 504 unique genes were subject to a further cut-off of P < 0.05 (horizontal dotted blue line) and a log2-fold change of ±1 (vertical dotted blue lines) for ILK gRNA 2-bosutinib vs. PX459v2-bosutinib. D, Heatmap of the 134 unique and significantly changed genes shown in C, across all 12 samples. Heatmap created using the ggplots R package. Euclidean distance and complete linkage clustering were used. E, ToppGene gene ontology analysis for the 134 unique DEGs. The top hits from the biological process category are shown. Black dots represent q values. F, Integrin-collagen network map from the 134 unique DEGs created using GeneMANIA in Cytoscape. Associated genes were determined in GeneMANIA based on published databases and specific omics publications.

