. 2022 Sep 27;11:e81088. doi: 10.7554/eLife.81088

Figure 2. The ovary transitions from elongated to crescent-shaped during late gestation.

(A) Optical sections from confocal Z-stacks of whole immunostaining of ovary/mesonephros complexes at E14.5, E17.5, and E18.5 immunostained for FOXL2 (cyan) and counterstained with Hoechst nuclear dye (grayscale). (B) 3D model generated by isosurface segmentation of lightsheet images taken of whole ovaries at E14.5, E17.5, and P0 immunostained for FOXL2 (cyan). Top large panels represent the dorsal view, while small bottom panels illustrate ventral, medial, and lateral views of the same ovary. Dashed arrows illustrate the change in conformation of the ovary as it develops: red arrows, relocation of the anterior and posterior poles; green arrows, medial inflexion; orange arrows, increase in lateral concavity. (C) Cranial and caudal views of the surface of the ovaries presented in (B). White arrows point to the dorsal protrusion of the ovarian domain. A, anterior pole; MD, Müllerian duct; Mn, mesonephros; Ov, ovary; P, posterior pole. Compasses on the bottom left of each panel indicate the orientation of the ovary: A, anterior; D, dorsal; L, lateral; M, medial; P, posterior; V, ventral. Scale bars, 100 μm.

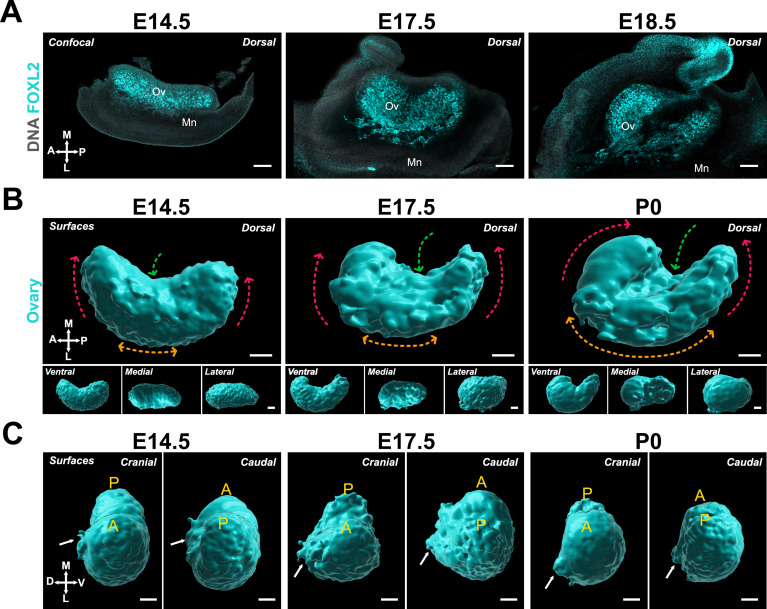
Figure 2.

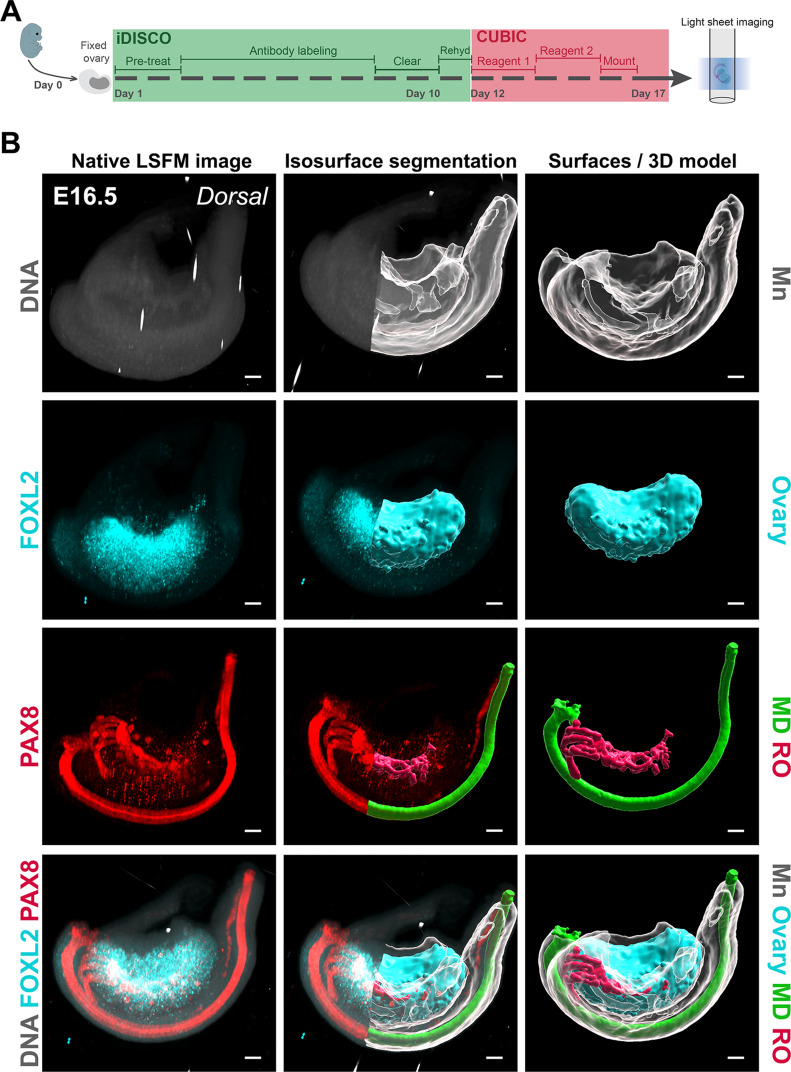
Figure 2—figure supplement 1. Approach to generate 3D models of the developing ovary.

Figure 2—figure supplement 1.

(A) Schematic depicting the basic pipeline for producing 3D images of the fetal mouse ovary using iDISCO+CUBIC tissue clearing and lightsheet microscopy. (B) Approach for generating 3D models in Imaris software using isosurface segmentation of lightsheet images for each of the main markers used in this study. The left column shows the 3D maximum intensity projection view of the raw lightsheet Z-stack of an ovary/mesonephros complex E16.5 immunostained for FOXL2 (cyan) and PAX8 (red), and counterstained with Hoechst nuclear dye (grayscale); the middle column shows the process of isosurface segmentation in Imaris and the right column shows the final 3D surfaces used in the figures throughout the manuscript. MD, Mullerian duct; Mn, mesonephros; RO, rete ovarii. Scale bars, 100 μm.
Figure 2—video 1. Imaris workflow.
Download video file (7MB, mp4)
The video shows the 3D rendering of native lightsheet images of an E14.5 ovary mesonephros complex labeled with FOXL2 to visualize the gonad (cyan), PAX8 to visualize the reproductive ducts (red), and Hoechst nuclear dye to visualize the whole complex (grayscale). The next frames show the transition from native data to 3D models using isosurface segmentation in Imaris software and rotation of the sample to capture different 3D views of the ovary and mesonephros in their native conformation.