. 2022 Sep 27;11:e81088. doi: 10.7554/eLife.81088

Figure 6. Developmental dynamics of the rete ovarii correlate with ovary morphogenesis.

(A) Maximum intensity projections from confocal Z-stacks of whole ovary/mesonephros complexes at E14.5, E16.5, E17.5, E18.5, and P5, immunostained for FOXL2 (cyan) and PAX8 (red), and counterstained with Hoechst nuclear dye (grayscale). Samples in the top row were imaged from the dorsal side and samples from the bottom row from the lateral side. Side panels in (A, E17.5) are close-ups of the three regions of the RO outlined at E17.5 (from top to bottom: EOR, CR, and IOR). (B) 3D models generated by isosurface segmentation of lightsheet images taken of whole ovaries at E14.5, E17.5, and P0 immunostained for FOXL2 (cyan) and PAX8 (Müllerian duct, green; and Rete ovarii, red). All samples were counterstained with Hoechst nuclear dye (grayscale). Top panels represent the dorsal view, middle panels represent the medial view, and small bottom panels illustrate ventral and lateral views of the same ovary. Yellow asterisks indicate the location of the infundibulum of the presumptive oviduct for reference. Compasses on the bottom left of each panel indicate the orientation of the ovary: ; D, dorsal; L, lateral; M, medial; V, ventral. (C) Lightsheet images of whole ovaries from 3-month-old mice immunostained for AMH (cyan) and PAX8 (red). The top panel shows the extended slice view of the native image, while the bottom panel illustrates the 3D surfaces of the RO (PAX8, red) and ovarian follicles (AMH, cyan) generated by isosurface segmentation of the same image. Images in the right panel are close-ups of the three regions of the RO in an adult ovary: top—EOR; middle—CR; bottom—IOR. CR, connecting rete; EOR, extraovarian rete; IOR, intraovarian rete; MD, Müllerian duct; Mn, mesonephros; MT, mesonephric tubules; Mv, mesovarium; OC, ovarian capsule; Ov, ovary; RO, rete ovarii; WD, Wolffian duct. Scale bars, 100 μm.

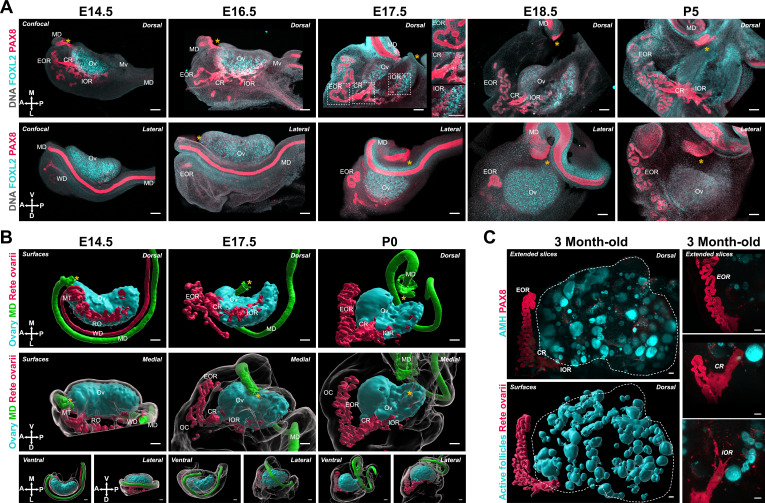
Figure 6.

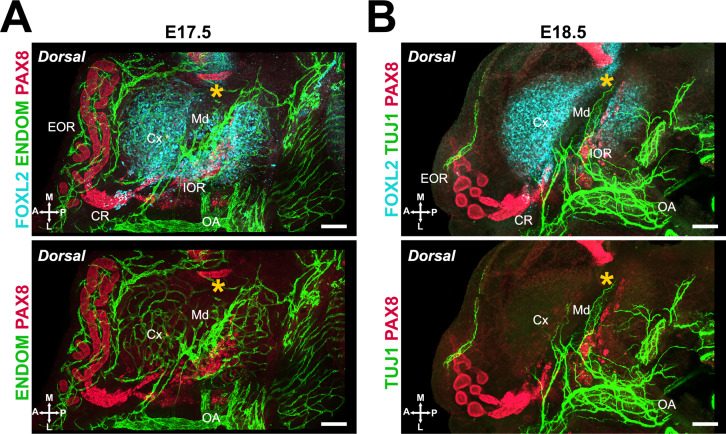
Figure 6—figure supplement 1. The IOR and CR coincide with the point of entry of vasculature and innervation into the ovary.

Figure 6—figure supplement 1.

(A) Maximum intensity projections from confocal Z-stacks of the dorsal side of the whole ovary/mesonephros complex at E17.5 immunostained for ENDOMUCIN (green) and PAX8 (red). (B) Maximum intensity projections from confocal Z-stacks of a whole ovary/mesonephros complex at E18.5 immunostained for TUJ1 (green) and PAX8 (red), imaged from the dorsal side. Yellow asterisks indicate the location of the infundibulum of the presumptive oviduct for reference. CR, connecting rete; Cx, cortex; EOR, extraovarian rete; IOR, intraovarian rete; Md, medulla; OA, ovarian artery. Compasses on the bottom left of each panel indicate the orientation of the ovary: D, dorsal; L, lateral; M, medial; V, ventral. Scale bars, 100 μm.
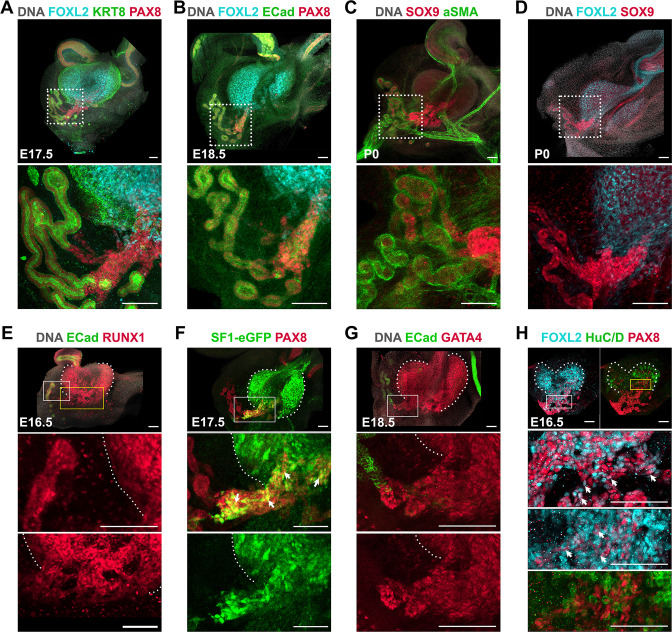
Figure 6—figure supplement 2. Expression of known epithelial and gonadal markers in the different regions of the rete ovarii.

Figure 6—figure supplement 2.

(A–D) Maximum intensity projections from confocal Z-stacks of whole ovary/mesonephros complexes at E17.5, E18.5, or P0, imaged from the dorsal side. Images in the bottom row are close-ups of the areas outlined in the top row. (A) Immunostaining for FOXL2 (cyan), PAX8 (red), and KERATIN-8 (KRT8, green). (B) Immunostaining for FOXL2 (cyan), PAX8 (red), and E-CADHERIN (ECad, green). (C) Immunostaining for SOX9 (cyan) and aSMA (red). (D) Immunostaining for FOXL2 (cyan) and SOX9 (red). (E–H) Maximum intensity projections from confocal Z-stacks of whole ovary/mesonephros complexes from wild-type (E, G, H) or Sf1-eGFP (F) embryos at E16.5 (E, H), E17.5 (F), or E18.5 (G), imaged from the dorsal side. (E) Immunostaining for RUNX1 (red) and E-CADHERIN (ECad, green). (F) Immunostaining E17.5 Sf1-eGFP for GFP (green) and PAX8 (red). (G) Immunostaining for ECad (cyan) and GATA4 (red). (H) Immunostaining for FOXL2 (cyan), PAX8 (red), and HuC/D (green). White arrows point to PAX8+ cells that are also labeled with gonadal markers. Images in the bottom rows are close-ups of the areas outlined in the top row. Yellow rectangles in (E) and (H) outline the regions blown up in the lowest row. Scale bars, 100 μm.