Figure 5.
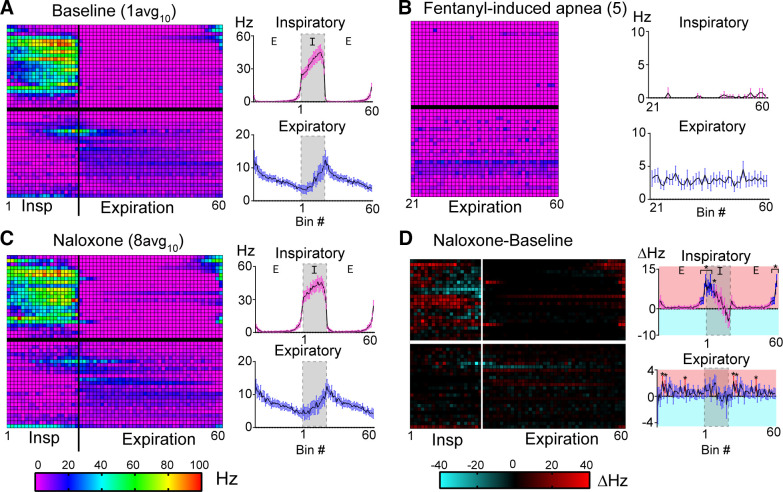
Phasic activity of dorsolateral pontine single units during baseline, fentanyl-induced apnea, and naloxone recovery. A–C, left: phase fraction two-dimensional (2-D) histogram (heatmap) displays activity of individual recorded units (n = 47) during baseline (A, epoch “1avg10” from Fig. 1), fentanyl-induced apnea (B, epoch 5 from Fig. 1), and naloxone recovery (C, epoch “8avg10” from Fig. 1). Each row represents a single unit from an individual experiment (one unit/experiment). Rows were divided into the inspiratory (top; unit Nos. 1–23) and expiratory (bottom; unit Nos. 24–47) classes. Row number corresponds to unit No. in Figs. 2 and 3. Inspiration was divided into 20 consecutive fractional bins (1–20) and expiration was divided into 40 consecutive fractional bins (21–60). Only the expiratory phase was sampled during apnea (B). Z-axis scale (bottom left) indicates average firing frequency per bin for 10 consecutive breaths. A–C, right: average firing frequency per bin of all units in the inspiratory class (top) or expiratory class (bottom). Line and error are means ± SE. Expiration was duplicated to display phase transitions. D: baseline-subtracted difference plot for firing frequency per bin in naloxone for individual units (left, Z-axis scale at bottom right) or averaged among inspiratory (top) or expiratory (bottom) class neurons (right). D, right: bins with significant differences from zero are shown in blue (inspiratory class) and red (expiratory class). *P < 0.05, by one-sample Wilcoxon signed-rank test.

