
Figure 3.
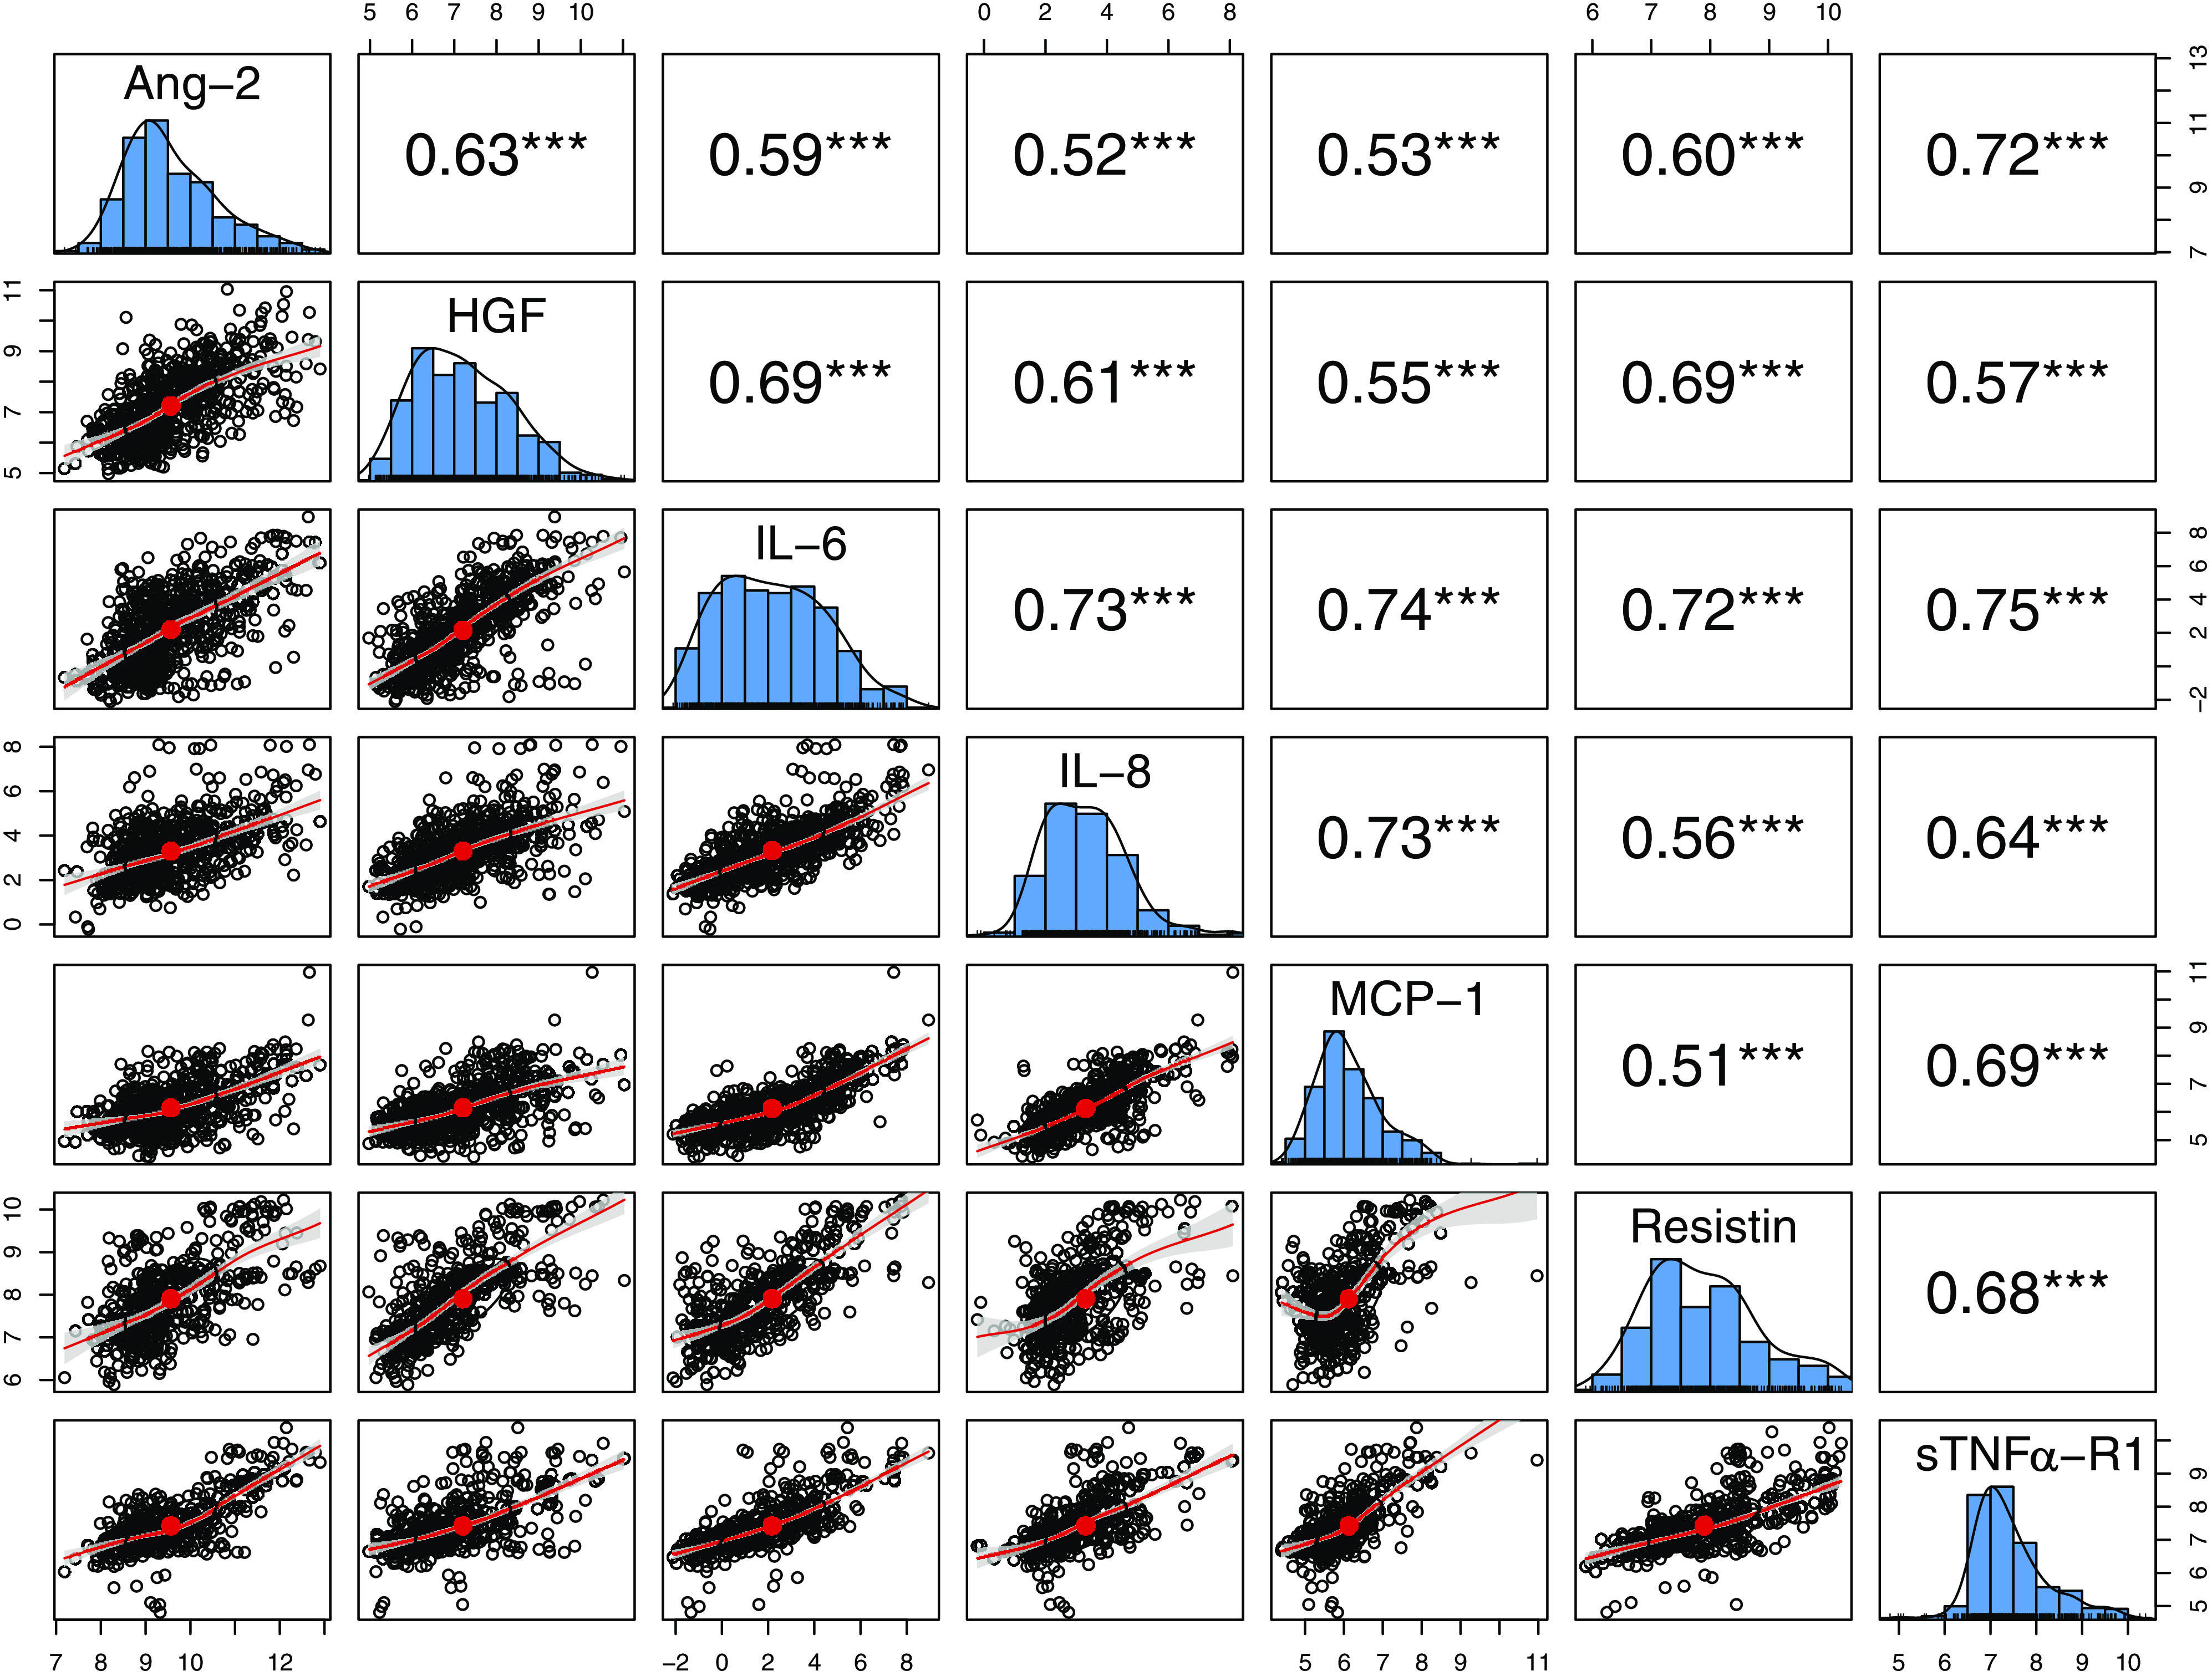
Summary of correlations between angiopoietin-2 (Ang-2), hepatocyte growth factor (HGF), interleukin-6 (IL-6), interleukin-8 (IL-8), monocyte chemoattractant protein-1 (MCP-1), resistin, and soluble TNF-α receptor 1 (sTNFα-RI). Pairwise correlation matrix for all biomarkers measured across all time points and all subjects. Cytokine levels are plotted on a log scale. ***Spearman’s correlations presented in the top right with all correlations statistically significant at P < 0.001.