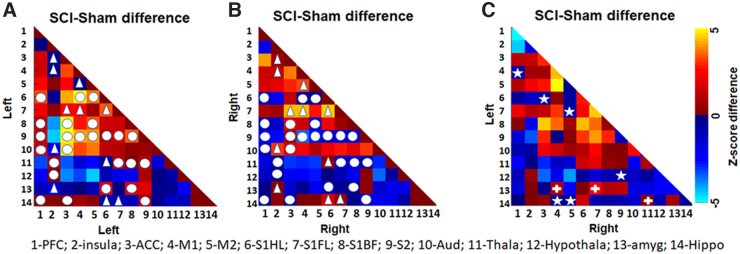
FIG. 2.
Inter- and intrahemisphere connectivity changes brought about by SCI. (A) Left-left RSFC difference between SCI and sham (B). Right-right RSFC difference between SCI and sham and (C) left-right RSFC difference between SCI and sham. Colors represent z-score differences. Circle represents intrahemispheric RSFC, which increased between two regions in the left hemisphere after SCI, showing a decrease between the same regions in the right hemisphere after SCI. Triangle represents intrahemispheric RSFC, which decreased between two regions in the left hemisphere after SCI, showing an increase between the same regions in the right hemisphere after SCI. Star represents the RSFC, which decreased between two regions across the hemispheres after SCI, but showed an increase within hemispheres after SCI. Plus (“+”) represents the RSFC, which increased between two regions across the hemisphere after SCI, but showed a decrease within hemispheres after SCI. RSFC, resting-state functional connectivity; SCI, spinal cord injury.

