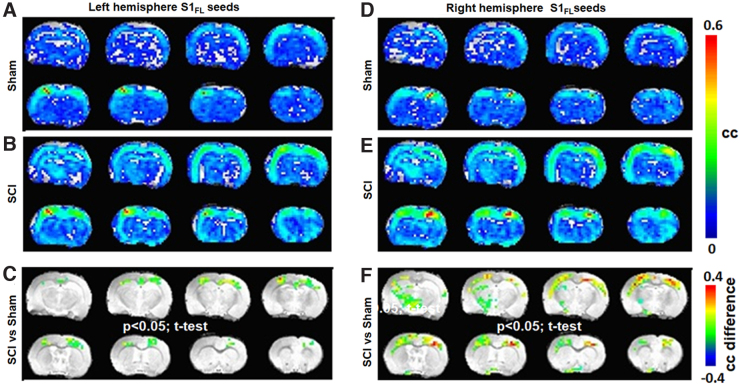
FIG. 4.
Average RSFC obtained using S1FL seed voxels across sham (n = 7) and SCI groups (n = 11) from the (A–C) left hemisphere and (D–F) right hemisphere. Color bar represents the correlation coefficient (cc). Significant difference map of correlation coefficient values (SCI > sham; color bar representing the difference in cc). Activated voxels were statistically determined using a two-tailed t-test with an activation threshold of p < 0.05 and corrected for multiple comparisons by a family-wise error control using a cluster size of 30 voxels. Average RSFC maps represent 6 S1FL seed voxels × 3 experimental runs × 7 animals = 126 for sham and 6 S1FL seed voxels × 3 experimental runs × 11 animals = 198 for SCI. Image orientation is in the neurological convention. RSFC, resting-state functional connectivity; SCI, spinal cord injury.

