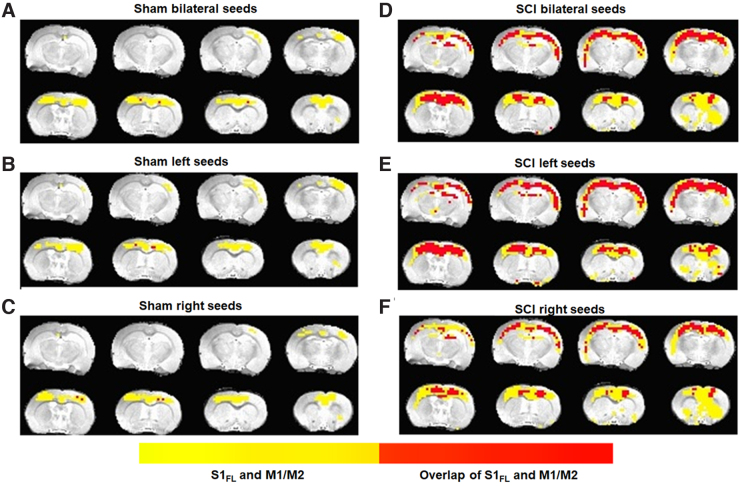
FIG. 6.
Average spatial extent of the S1FL and M1/M2 resting-state networks (yellow) and their overlap (red) across sham (n = 7) and SCI (n = 11) groups. The z-transformed RSFC maps were averaged across animals in each group and subsequently inverse z-transformed to obtain the average correlation coefficient value map. A threshold of cc = 0.15 was used to generate the sensory and motor RSFC networks respectively. Image orientation is in the neurological convention. RSFC, resting-state functional connectivity; SCI, spinal cord injury.

