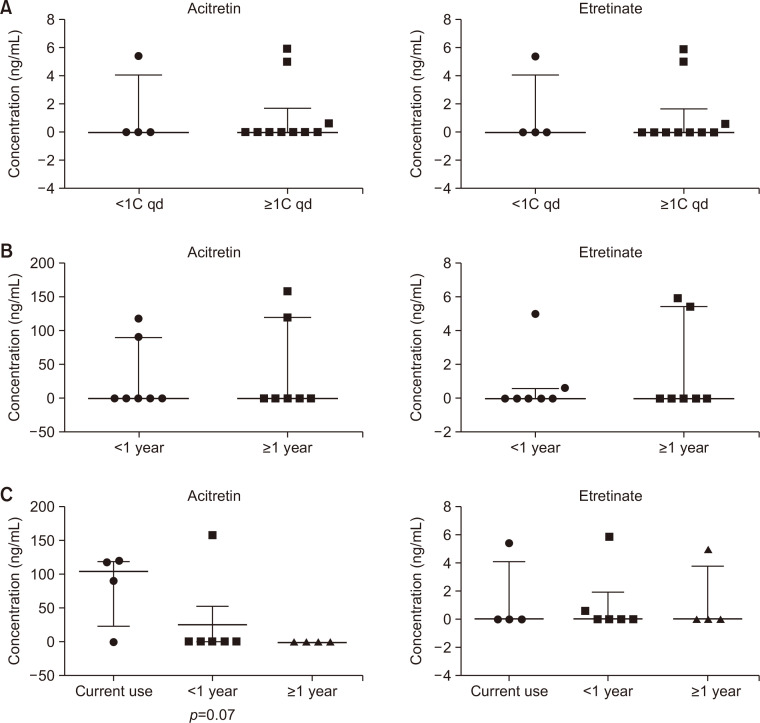
Fig. 2.
Effects of acitretin dosage, administration duration, and discontinuation duration on serum acitretin and etretinate concentrations. Serum concentrations of acitretin (left side on each graph) and etretinate (right side on each graph) were analyzed in 14 patients who received acitretin according to the dosage, administration duration, and discontinuation duration. (A) Vertical scatter plot for the administration dosage subgrouped as less than one capsule per day and one or more capsules per day. (B) Vertical scatter plot for the administration duration subgrouped as less than one year and more than one year. (C) Vertical scatter plot for the discontinuation duration subgrouped as currently taking, discontinue for less than one year, and discontinued for more than one year. The thicker line of each graph indicates median value, and the thinner one indicates interquartile range.

