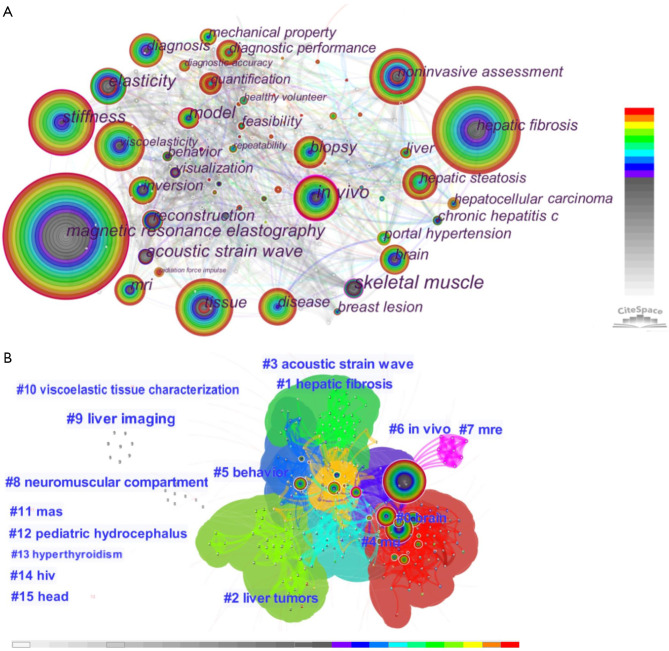
Figure 7.
Co-occurrence keyword networks in MRE from 1995 to 2021. (A) Map of co-occurring keywords. Each node represents a co-occurring keyword, with the size of the node proportional to the number of articles published. The colored rings in each node indicate years of publication, ranging from cool (early) to warm (recent); purple trims appear in those nodes with higher betweenness centrality. (B) Cluster analysis map of co-occurring keywords, with overall modularity Q=0.54 and mean silhouette S=0.78 (indicating that the classification was reasonable and the interior of the cluster was uniform). The network was divided into 16 clusters. The different-colored shapes represent different clusters, with the colors indicating years of publication. The cluster number represents the frequency of the keywords in the publications. The smaller the cluster number, the higher the frequency. MRE, magnetic resonance elastography.

