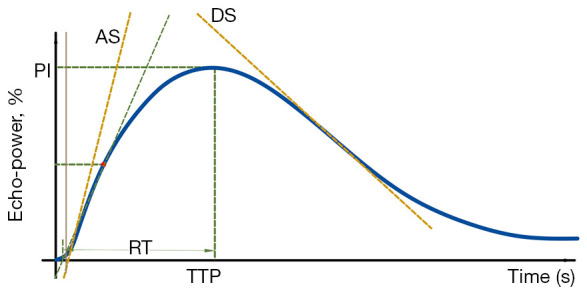
Figure 6.

The curve drawing with perfusion parameters obtained from the quantitative analysis of the CEUS examination. CEUS, contrast-enhanced ultrasound; PI, peak intensity; RT, rise time; TTP, time to peak; AS, the maximum slope rate of ascending curve; DS, the maximum slope rate of descending curve.
