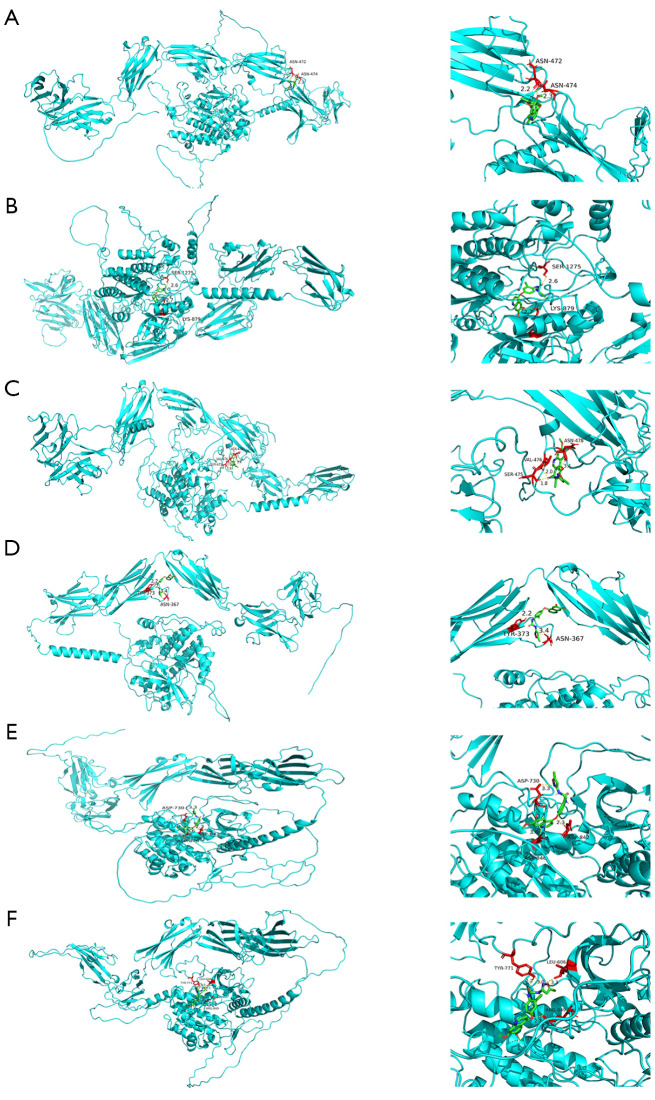
Figure 10.
Core protein docking with tivozanib. The molecules and drugs with the lowest docking energies are visualized in Figure 9. (A-F) Visualization of molecular docking results for FLT1, FLT4, KDR, KIT, PDGFRA, and PDGFRB proteins in tivozanib, in that order. Small molecule drugs and interacting amino acids are red, proteins are blue, their interactions are yellow dotted lines, and numbers are bond lengths.

