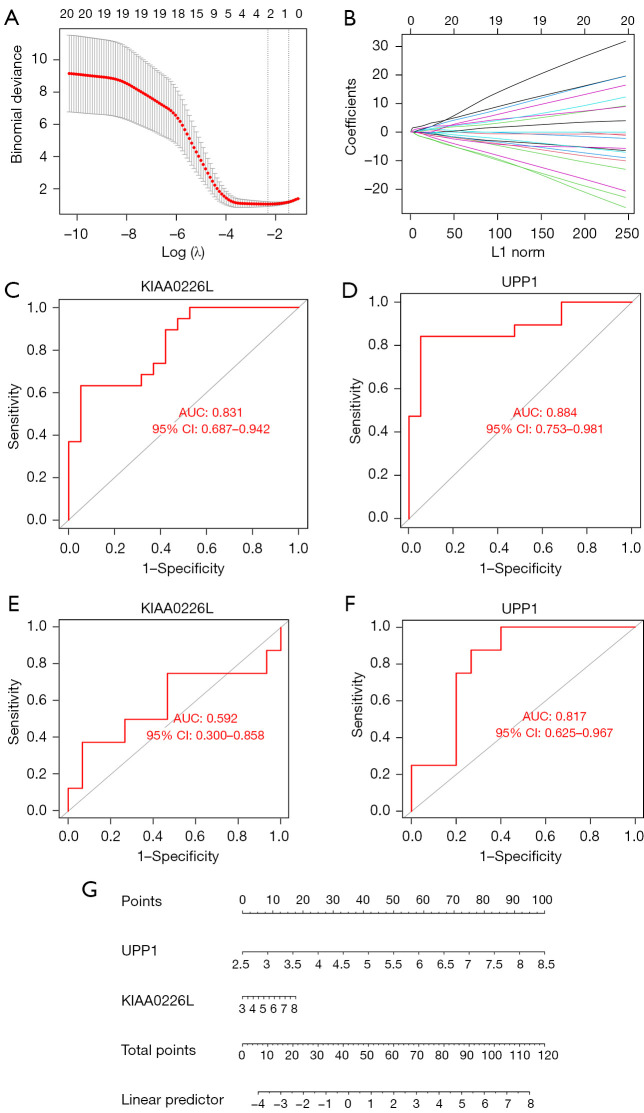
Figure 6.
Logistic regression models can largely distinguish between RIAs and normal samples. (A,B) 5-fold cross-validation of LASSO constructed from 24 intersecting genes. (C,D) ROC analysis of KIAA0226L and UPP1 in the GSE13353 and GSE15629 training set. (E,F) ROC analysis of KIAA0226L and UPP1 in the GSE54083 validation set. (G) A nomogram was constructed to predict the probability of rupture in IA patients. The values of each variable (KIAA0226L and UPP1) are summed to obtain a total score. The probability can be calculated by drawing a vertical line from the total score axis to the probability scale. x-axis: FPR, false positive rate; y-axis: TPR, true positive rate; AUC, area under the curve; LASSO, least absolute shrinkage and selection operator; ROC, receiver operating characteristic; CI, confidence interval; IA, intracranial aneurysm.

