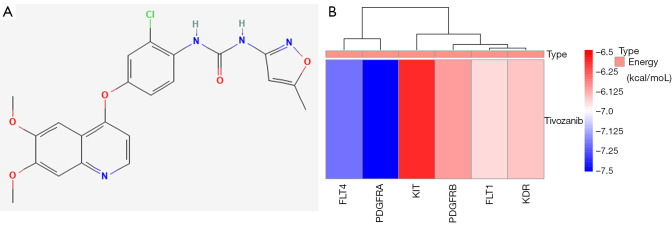
Figure 9.
Molecular docking energy heat map. (A) The 2D structure of tivozanib. (B) Molecular docking of FLT1, FLT4, KDR, KIT, PDGFRA, and PDGFRB proteins in tivozanib, and the docking energy drawn into a heat map. Red represents high docking energy required, and blue represents low docking energy required, the ordinate value is the energy of docking (kcal/moL).

