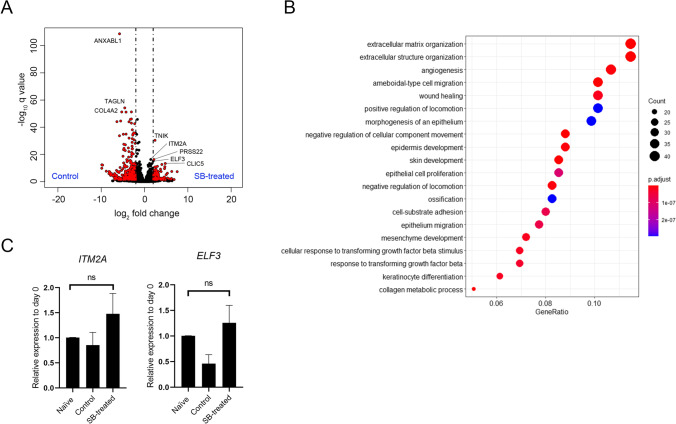
Fig. 2.
Differentially expressed genes obtained from comprehensive transcriptome analysis. (A) Volcano plot of DEGs obtained by the Wald test using DESeq2 for the comparison of control and SB-treated cells. The x-axis represents the log base 2 of the gene expression ratio. The y-axis represents the negative log10 of the adjusted q value. Red dots represent DEGs meeting the stringency cutoff; adjusted p value < 0.05 and |log2 fold change|> 2. (B) Enrichment analysis of Gene Ontology Biological Processes using Cluster Profiler. Top 20 annotations are shown. The x-axis represents the number of gene clusters in each cluster label. The color represents the adjusted p values, and the size of the spots represents the gene number. (C) RT–qPCR for the representative DEGs enriched in SB-treated cells. The data are shown as the mean ± SEM (n = 6)

