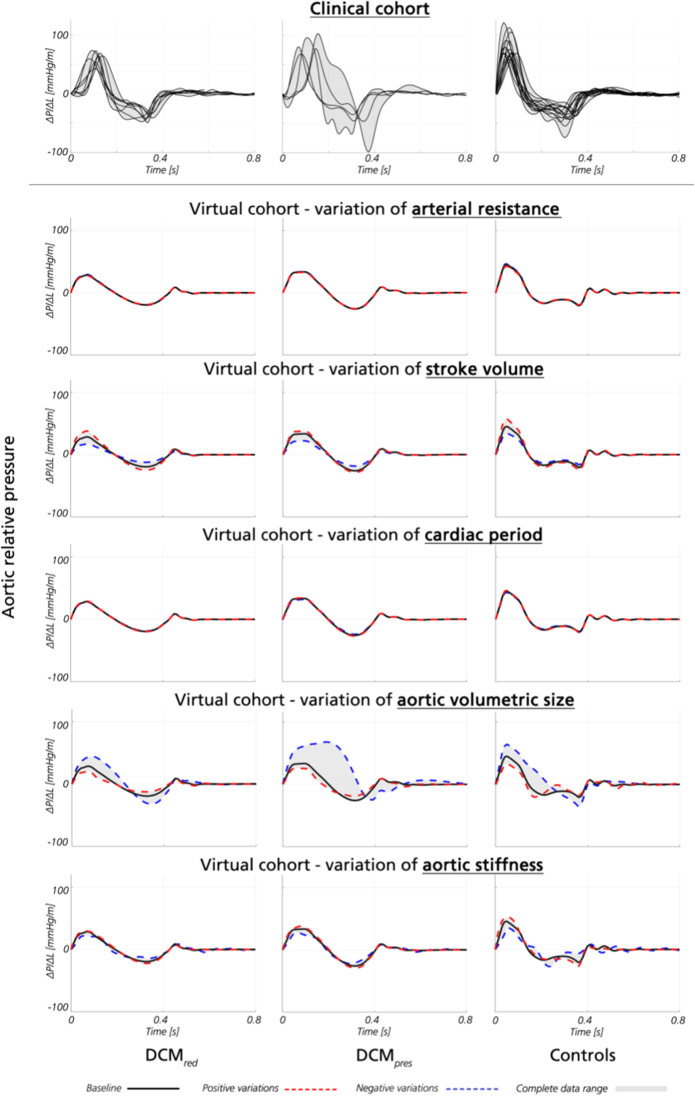
Fig. 4.
Aortic relative pressure traces from clinical and virtual analysis. Aortic relative pressure traces from the clinical (top row) and virtual cohort (remaining rows), presented as a function of isolated variations of arterial resistance, stroke volume, cardiac period, aortic volumetric size, and aortic stiffness, respectively. Relative pressure is shown for DCMred (left), DCMpres (middle), and controls (right). For the clinical data, each individual subject is given in black. For the virtual data, isolated variations around baseline (black) are given as positive variations (red) and negative variations (blue), respectively, superimposed on the data range (grey)

