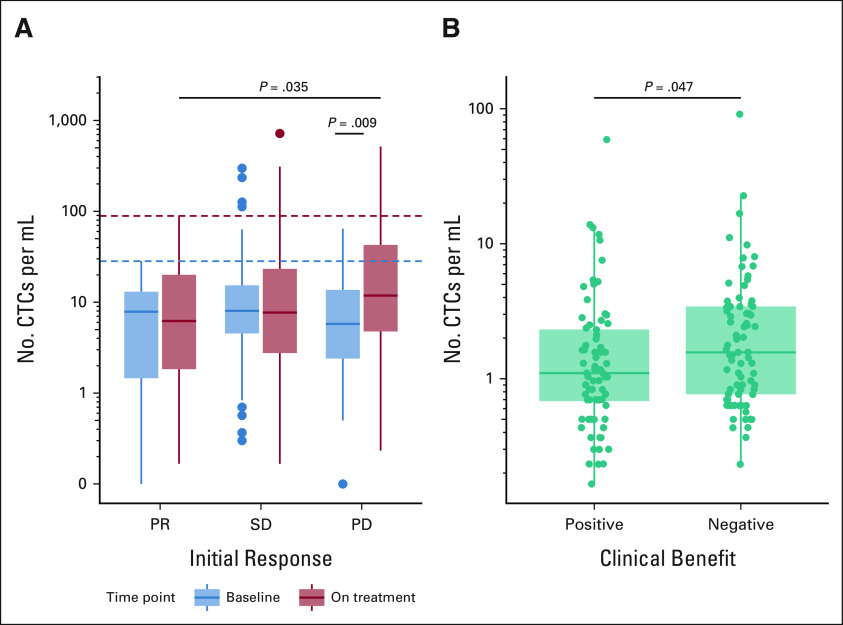
FIG 1.
CTCs per milliliter of blood, grouped by treatment response. (A) All OM collections, grouped by their collection timing (baseline in blue and on-treatment in red) and confirmed response during nivolumab induction (PR, SD, PD). Dashed lines represent the maximum CTCs per milliliter exhibited by partial responders at baseline (28.3 CTCs/mL, blue) and during treatment (89 CTCs/mL, red). (B) All UW collections, grouped by the clinical benefit associated with that collection. CTC, circulating tumor cell; OM, OMNIVORE; PD, progressive disease; PR, partial response; SD, stable disease; UW, University of Wisconsin.

