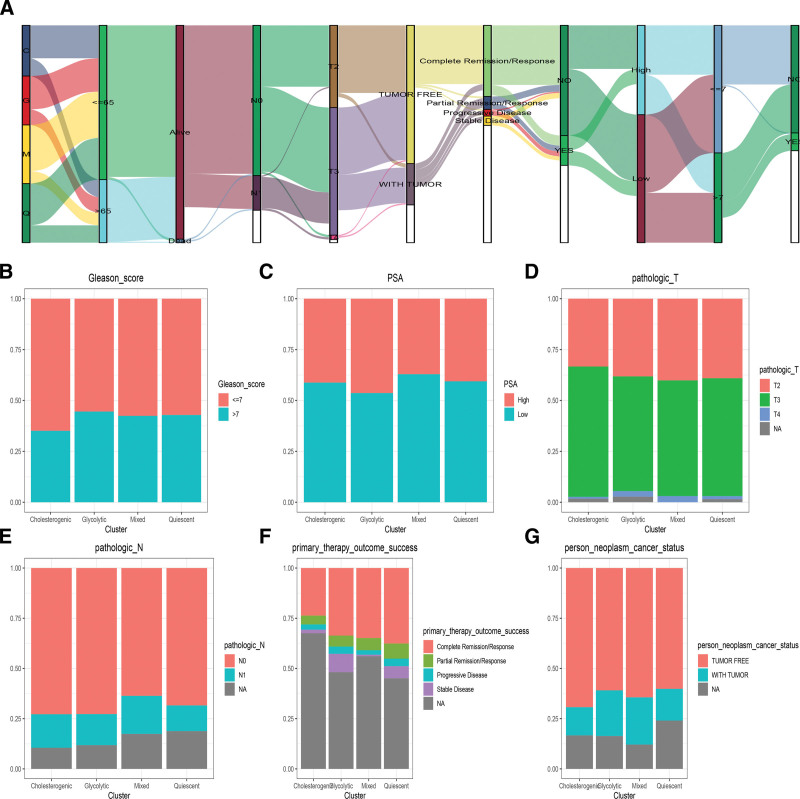
Figure 2.
Clinical characteristics of Metabolic subgroups. The correlation between Metabolic subgroups and Clinical characteristics is integrated into a module map (A). The Stacked histogram was shown the association metabolic subgroups and Gleason score (B) and PSA score (C), pathologic T (D), N stage (E), primary therapy outcome success (F), and new tumor events (G).

