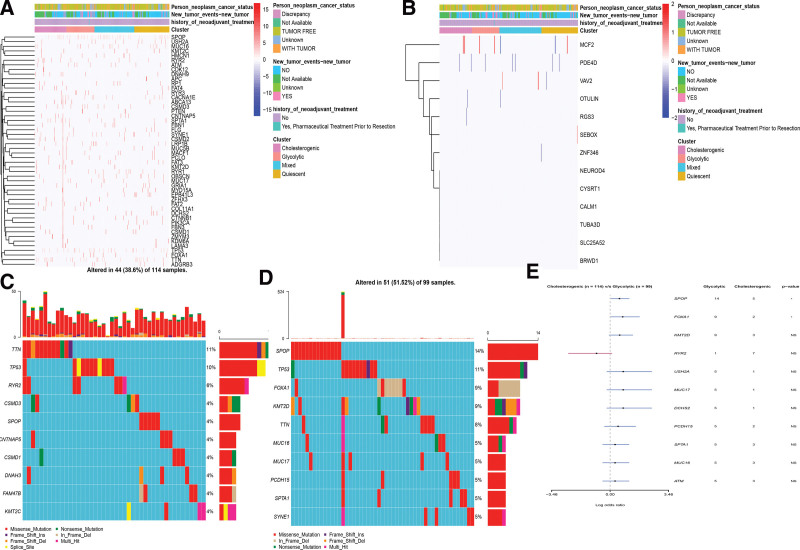
Figure 5.
The landscape of mutations among PCa metabolic subgroups.This heat map showed the distribution of somatic mutation (SNP) (A) and CNV (B) events that affected frequently mutated genes across metabolic subgroups in PCa. (C) Mutation analysis between the glycolytic and cholesterogenic subsets. (D) Gene mutation map of highly mutated genes between the 2 subtypes. (E) The forest plot exhibited a comparison of gene mutations between the 2 subtypes (*P: .1, **P: .05, ns: not significant). PCa = prostate cancer.

