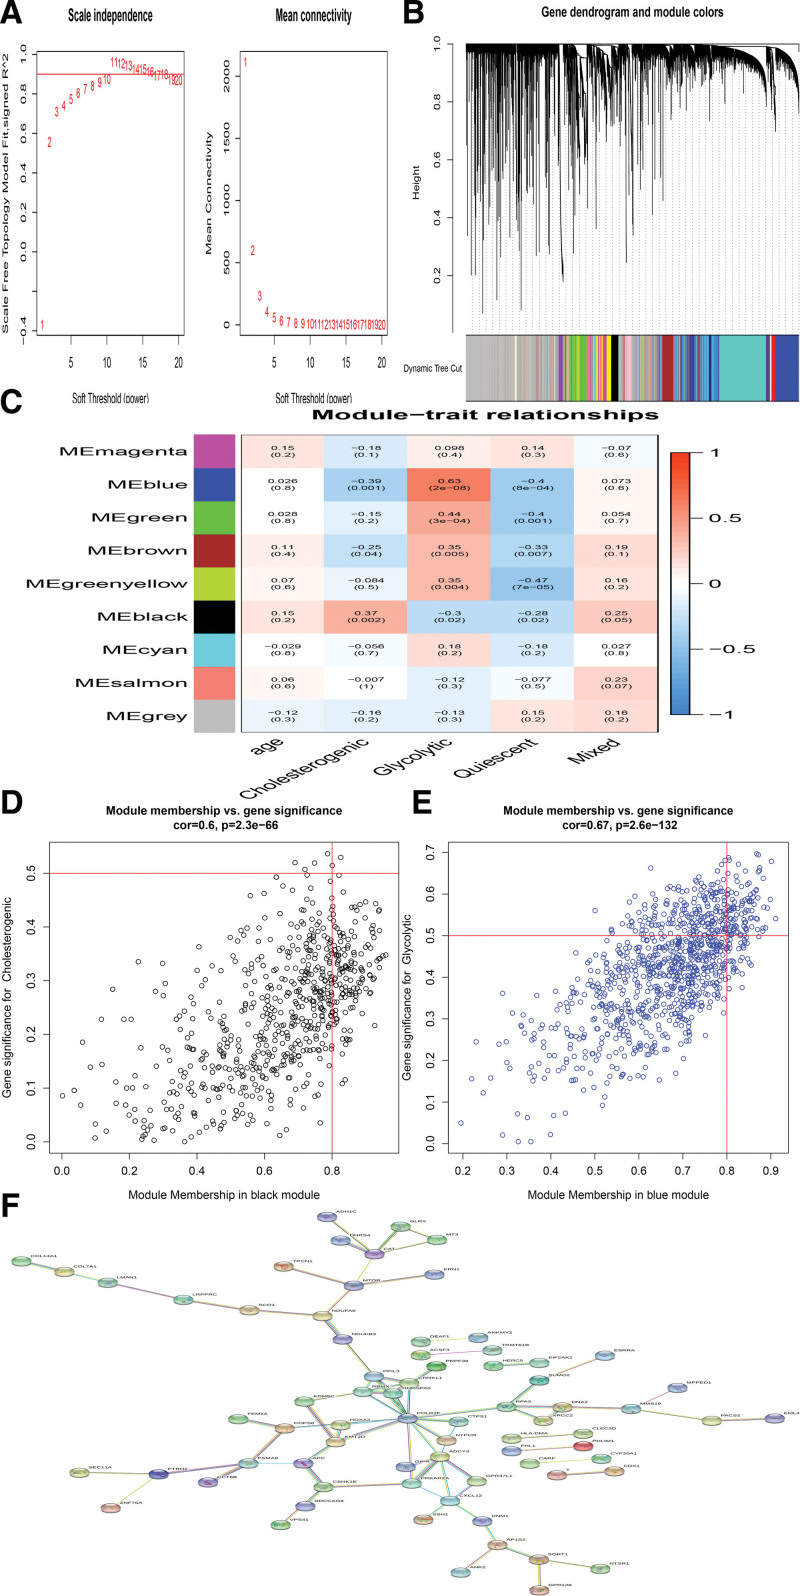
Figure 7.
The weighted gene correlation network analysis (WGCNA). (A). better soft threshold was identified. (B). Gene dendrogram and module colors using WGCA method. (C).The WGCNA analysis exhibited that 2 sets of genes (modules) significantly correlated with glycolytic and cholesterogenic subsets. (D and E). Module membership versus gene significance was plotted in glycolytic and cholesterogenic subsets. (F).The identification of PCa subtype-specific networks.

